

Question: 2. Complete the below table to calculate income statement data in common-size percents. Note: Round your percentage answers to 2 decimal places. KORBIN COMPANY
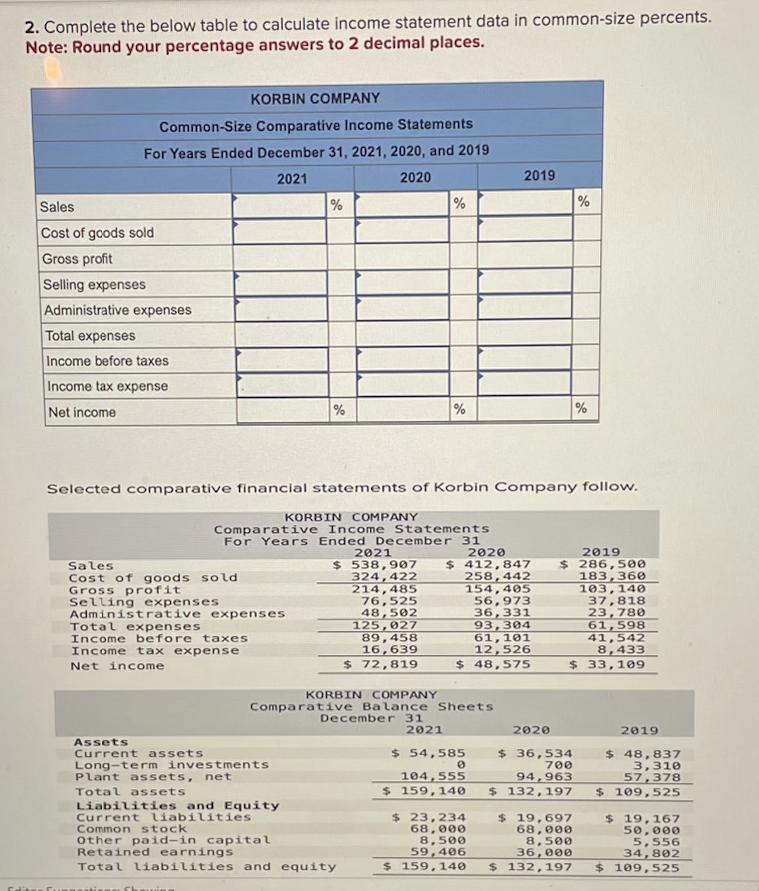
2. Complete the below table to calculate income statement data in common-size percents. Note: Round your percentage answers to 2 decimal places. KORBIN COMPANY Common-Size Comparative Income Statements For Years Ended December 31, 2021, 2020, and 2019 Sales Cost of goods sold Gross profit Selling expenses Administrative expenses Total expenses Income before taxes. Income tax expense Net income 2021 % 2020 2019 % % % % % Selected comparative financial statements of Korbin Company follow. Sales KORBIN COMPANY Comparative Income Statements For Years Ended December 31 Cost of goods sold Gross profit Selling expenses Administrative expenses Total expenses Income before taxes Income tax expense Net income 2021 $ 538,907 324,422 214,485 76,525 48,502 2020 $ 412,847 258,442 154,405 56,973 36,331 125,027 93,304 89,458 61,101 16,639 12,526 $ 72,819 $ 48,575 2019 $286,500 183,360 103, 140 37,818 23,780 61,598 41,542 8,433 $ 33,109 KORBIN COMPANY Comparative Balance Sheets. December 31 Assets Current assets Long-term investments Plant assets, net Total assets Liabilities and Equity Current liabilities. Common stock Other paid-in capital Retained earnings Total liabilities and equity 2021 2020 $ 54,585 104,555 0 $ 36,534 700 94,963 $ 159,140 $ 23,234 68,000 8,500 59,406 $ 159,140 $ 132,197 $ 19,697 68,000 8,500 36,000 $ 132,197 2019 $ 48,837 3,310 57,378 $ 109,525 $ 19,167 50,000 5,556 34,802 $ 109,525
Step by Step Solution
There are 3 Steps involved in it

Get step-by-step solutions from verified subject matter experts