

Question: 2. Consider the information in Table 1 Table 1 Expected Return (% Standard Deviation (% Covariance (Stock 1, Stock 2) Covariance (Stock 1, Stock 3)
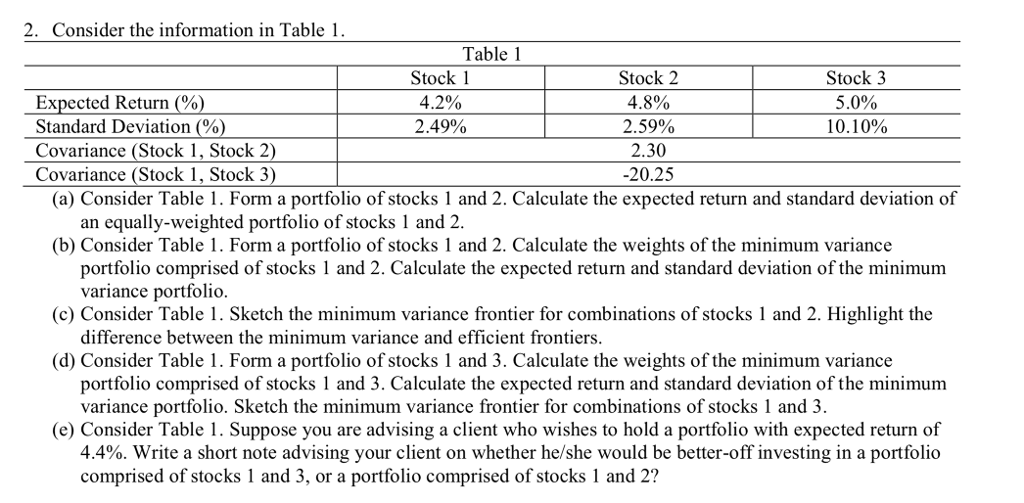
2. Consider the information in Table 1 Table 1 Expected Return (% Standard Deviation (% Covariance (Stock 1, Stock 2) Covariance (Stock 1, Stock 3) Stock 1 4.2% 2.49% Stock 2 48% 2.59% 2.30 -20.25 Stock 3 5.0% 10.10% (a) Consider Table 1. Form a portfolio of stocks 1 and 2. Calculate the expected return and standard deviation of an equally-weighted portfolio of stocks 1 and 2 (b) Consider Table 1. Form a portfolio of stocks 1 and 2. Calculate the weights of the minimum variance portfolio comprised of stocks 1 and 2. Calculate the expected return and standard deviation of the minimum variance portfolio difference between the minimum variance and efficient frontiers portfolio comprised of stocks 1 and 3. Calculate the expected return and standard deviation of the minimum (c) Consider Table 1. Sketch the minimum variance frontier for combinations of stocks 1 and 2. Highlight the (d) Consider Table 1. Form a portfolio of stocks 1 and 3. Calculate the weights of the minimum variance variance portfolio. Sketch the minimum variance frontier for combinations of stocks 1 and 3. (e) Consider Table 1. Suppose you are advising a client who wishes to hold a portfolio with expected return of 4.4%. Write a short note advising your client on whether he/she would be better-off investing in a portfolio comprised of stocks 1 and 3, or a portfolio comprised of stocks 1 and 2
Step by Step Solution
There are 3 Steps involved in it

Get step-by-step solutions from verified subject matter experts