Question: 2. Create a two-variable data table to calculate the gross profit based on the hours of management consulting contracted and the hourly rate charged: a.
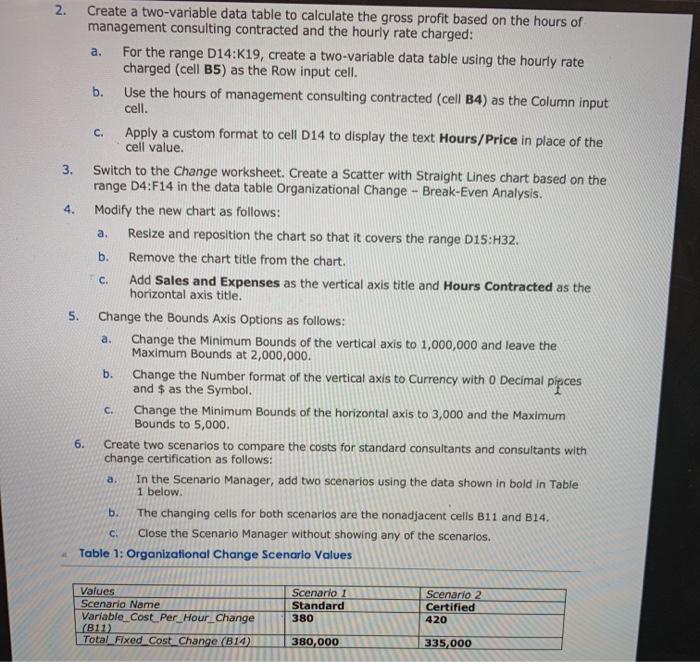
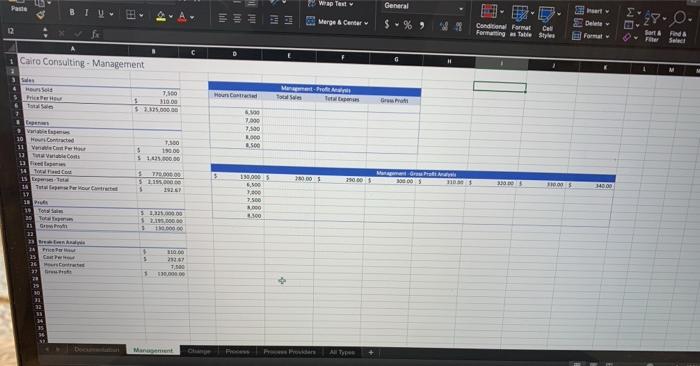
2. Create a two-variable data table to calculate the gross profit based on the hours of management consulting contracted and the hourly rate charged: a. For the range D14:K19, create a two-variable data table using the hourly rate charged (cell B5) as the Row input cell. b. Use the hours of management consulting contracted (cell B4) as the Column input cell. C. Apply a custom format to cell D14 to display the text Hours/Price in place of the cell value. 3. Switch to the Change worksheet. Create a Scatter with Straight Lines chart based on the range D4:F14 in the data table Organizational Change - Break-Even Analysis. 4. Modify the new chart as follows: a. Resize and reposition the chart so that it covers the range D15:H32. b. Remove the chart title from the chart. C. Add Sales and Expenses as the vertical axis title and Hours Contracted as the horizontal axis title. 5. Change the Bounds Axis Options as follows: Change the Minimum Bounds of the vertical axis to 1,000,000 and leave the Maximum Bounds at 2,000,000. b. Change the Number format of the vertical axis to Currency with 0 Decimal pipices and $ as the Symbol. C. Change the Minimum Bounds of the horizontal axis to 3,000 and the Maximum Bounds to 5,000. 6. Create two scenarios to compare the costs for standard consultants and consultants with change certification as follows: In the Scenario Manager, add two scenarios using the data shown in bold in Table 1 below. b. The changing cells for both scenarios are the nonadjacent cells B11 and 314. Close the Scenario Manager without showing any of the scenarlos. Table 1: Organizational Change Scenario Values . a. a. C. Values Scenario Name Variable_Cost Per_Hour Change (B11) Total Fixed Cost Change (814) Scenario 1 Standard 380 Scenario 2 Certified 420 380,000 335,000 Wrap Text General Paste BI w 28.0 Merge & Center $ - % a Cardin Farmer Call Forming Table Styles Format Sant Fund + Cairo Consulting - Management S HC Marant - Profil Tools 7.100 310.00 2.125.000 10 Home 31 Vinter wont 6.90 2.000 7:50 3.000 1.500 T.500 $ 19000 $ 1.025.000.00 14 $ 770.000.00 9 2.295,000.00 1925 150.00025 5,500 0.00 Marra 100005 31.03 odont 1000 140.00 17 7.500 2.000 4.300 20 Top $1,225.00000 $1.000 1 1.000.00 D 34 BC 28 19 ore + S BOTE 7.300 130.000 1 10 11 LE 24 Manut Alpes 2. Create a two-variable data table to calculate the gross profit based on the hours of management consulting contracted and the hourly rate charged: a. For the range D14:K19, create a two-variable data table using the hourly rate charged (cell B5) as the Row input cell. b. Use the hours of management consulting contracted (cell B4) as the Column input cell. C. Apply a custom format to cell D14 to display the text Hours/Price in place of the cell value. 3. Switch to the Change worksheet. Create a Scatter with Straight Lines chart based on the range D4:F14 in the data table Organizational Change - Break-Even Analysis. 4. Modify the new chart as follows: a. Resize and reposition the chart so that it covers the range D15:H32. b. Remove the chart title from the chart. C. Add Sales and Expenses as the vertical axis title and Hours Contracted as the horizontal axis title. 5. Change the Bounds Axis Options as follows: Change the Minimum Bounds of the vertical axis to 1,000,000 and leave the Maximum Bounds at 2,000,000. b. Change the Number format of the vertical axis to Currency with 0 Decimal pipices and $ as the Symbol. C. Change the Minimum Bounds of the horizontal axis to 3,000 and the Maximum Bounds to 5,000. 6. Create two scenarios to compare the costs for standard consultants and consultants with change certification as follows: In the Scenario Manager, add two scenarios using the data shown in bold in Table 1 below. b. The changing cells for both scenarios are the nonadjacent cells B11 and 314. Close the Scenario Manager without showing any of the scenarlos. Table 1: Organizational Change Scenario Values . a. a. C. Values Scenario Name Variable_Cost Per_Hour Change (B11) Total Fixed Cost Change (814) Scenario 1 Standard 380 Scenario 2 Certified 420 380,000 335,000 Wrap Text General Paste BI w 28.0 Merge & Center $ - % a Cardin Farmer Call Forming Table Styles Format Sant Fund + Cairo Consulting - Management S HC Marant - Profil Tools 7.100 310.00 2.125.000 10 Home 31 Vinter wont 6.90 2.000 7:50 3.000 1.500 T.500 $ 19000 $ 1.025.000.00 14 $ 770.000.00 9 2.295,000.00 1925 150.00025 5,500 0.00 Marra 100005 31.03 odont 1000 140.00 17 7.500 2.000 4.300 20 Top $1,225.00000 $1.000 1 1.000.00 D 34 BC 28 19 ore + S BOTE 7.300 130.000 1 10 11 LE 24 Manut Alpes