

Question: 2. Develop a chart to calculate the between sample variation. begin{tabular}{|c|r|r|r|r|r|} hline & A & B & multicolumn{1}{|c|}{ C } & D & E
2. Develop a chart to calculate the "between" sample variation.
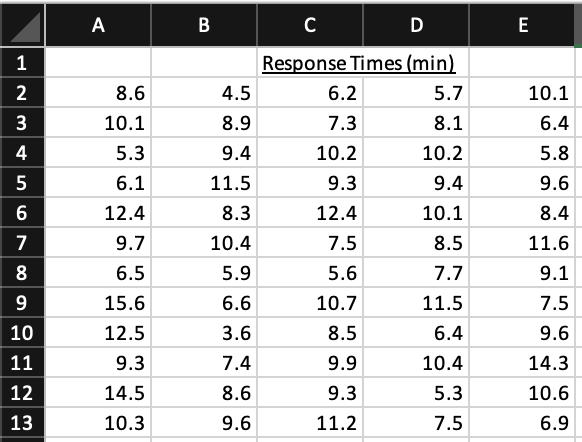
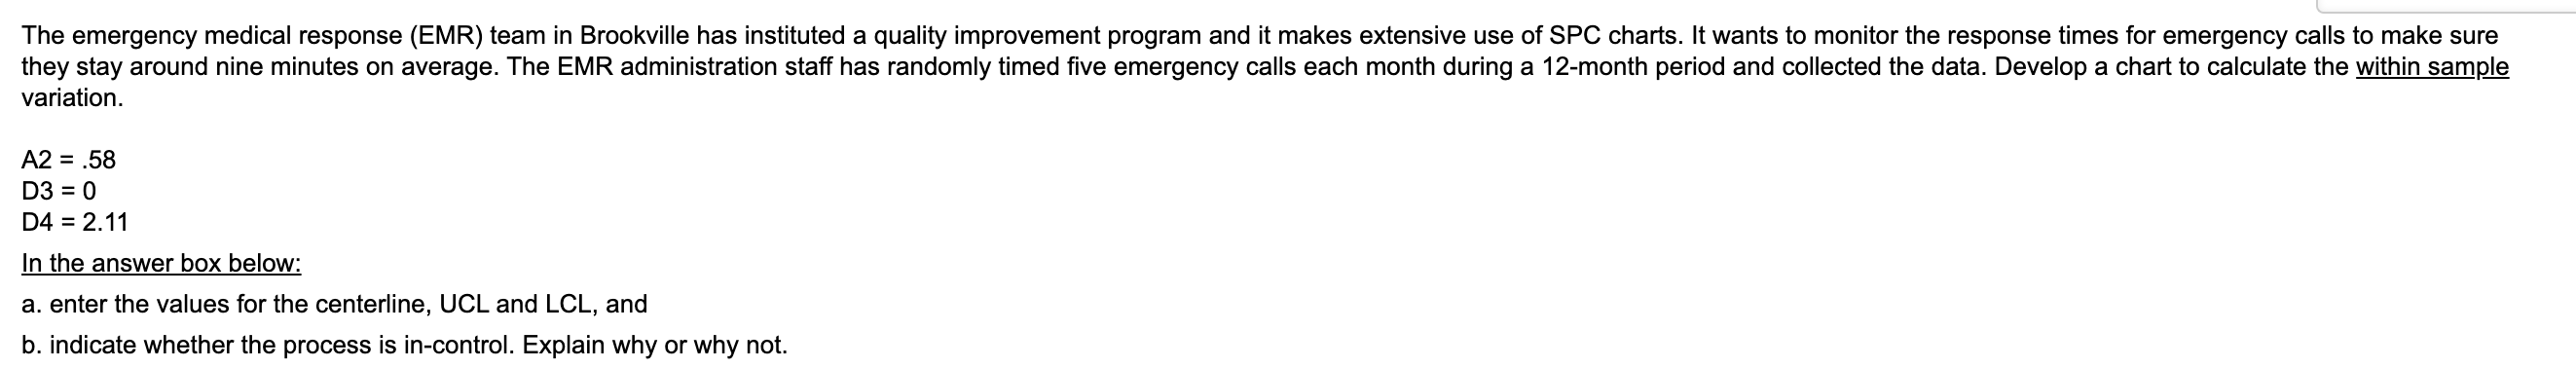
\begin{tabular}{|c|r|r|r|r|r|} \hline & A & B & \multicolumn{1}{|c|}{ C } & D & E \\ \hline 1 & & & Response Times (min) & \\ \hline 2 & 8.6 & 4.5 & 6.2 & 5.7 & 10.1 \\ \hline 3 & 10.1 & 8.9 & 7.3 & 8.1 & 6.4 \\ \hline 4 & 5.3 & 9.4 & 10.2 & 10.2 & 5.8 \\ \hline 5 & 6.1 & 11.5 & 9.3 & 9.4 & 9.6 \\ \hline 6 & 12.4 & 8.3 & 12.4 & 10.1 & 8.4 \\ \hline 7 & 9.7 & 10.4 & 7.5 & 8.5 & 11.6 \\ \hline 8 & 6.5 & 5.9 & 5.6 & 7.7 & 9.1 \\ \hline 9 & 15.6 & 6.6 & 10.7 & 11.5 & 7.5 \\ \hline 10 & 12.5 & 3.6 & 8.5 & 6.4 & 9.6 \\ \hline 11 & 9.3 & 7.4 & 9.9 & 10.4 & 14.3 \\ \hline 12 & 14.5 & 8.6 & 9.3 & 5.3 & 10.6 \\ \hline 13 & 10.3 & 9.6 & 11.2 & 7.5 & 6.9 \\ \hline \end{tabular} variation. A2=.58D3=0D4=2.11 In the answer box below: a. enter the values for the centerline, UCL and LCL, and b. indicate whether the process is in-control. Explain why or why not
Step by Step Solution
There are 3 Steps involved in it

Get step-by-step solutions from verified subject matter experts