

Question: 2. For the data in the table below: i. What do high kuntosis and skewness figures denote? ii. Free Sulphur dioxide and total Sulphur dioxide
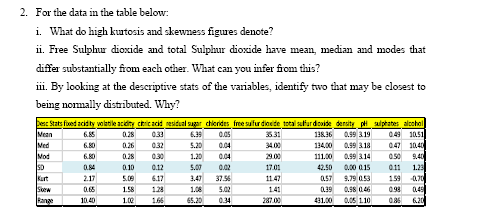
2. For the data in the table below: i. What do high kuntosis and skewness figures denote? ii. Free Sulphur dioxide and total Sulphur dioxide have mean, median and modes that differ substantially from each other. What can you infer from this? iii. By looking at the descriptive stats of the variables, identify two that may be closest to being normally distributed. Why? best Stats food acid ty volatile ackime cheic acid medieval sugar chlorides free sulfur dioxide total sulard colde density pill wilprobes alcchio 6.35 128.36 0.59 3.19 0.49 10.51 Ned 5.25 059 3.18 10.4 Nod 1.25 101.30 569 3.14 9.40 0.12 1.23 Furt 1.17 4.17 11 47 3.79 053 1 59 D. LE 1.04 5.02 1.41 45.25 034 421.50 305 1 10
Step by Step Solution
There are 3 Steps involved in it

Get step-by-step solutions from verified subject matter experts