

Question: 2. For the following graph of an exponential function y = a , tell whether the graph shows exponential growth or exponential decay. (3 pts)

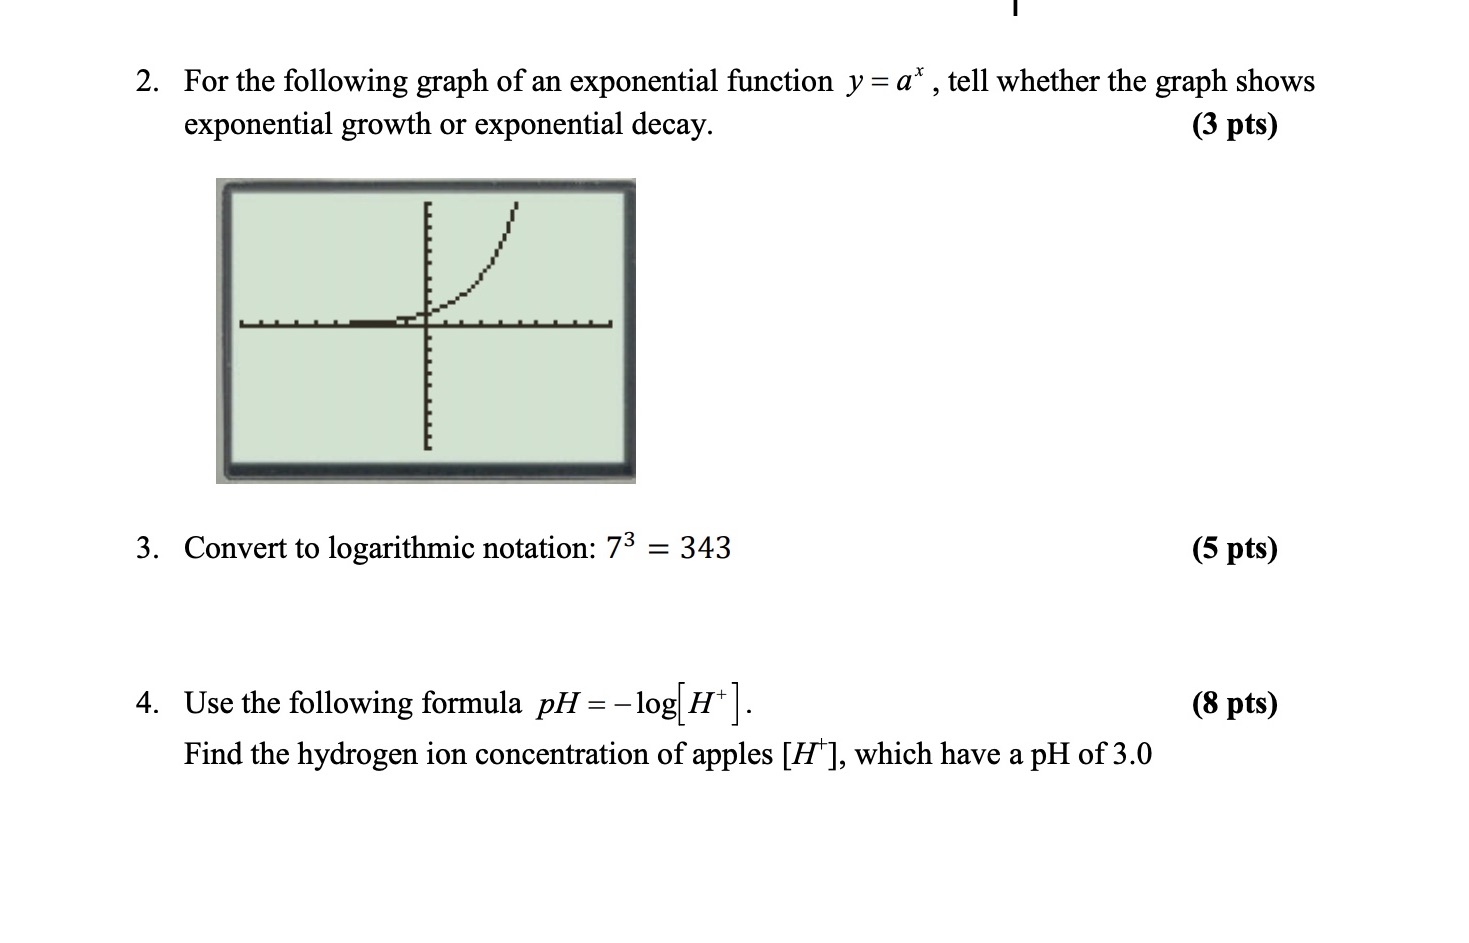
2. For the following graph of an exponential function y = a\" , tell whether the graph shows exponential growth or exponential decay. (3 pts) 3. Convert to logarithmic notation: 73 = 343 (5 pts) 4. Use the following formula pH = log[H+] . (8 pts) Find the hydrogen ion concentration of apples [Hi which have a pH of 3.0
Step by Step Solution
There are 3 Steps involved in it
1 Expert Approved Answer
Step: 1 Unlock

Question Has Been Solved by an Expert!
Get step-by-step solutions from verified subject matter experts
Step: 2 Unlock
Step: 3 Unlock