

Question: 2. For the following graph of an exponential function y = a, tell whether the graph shows exponential growth or exponential decay. (2 pts) grams
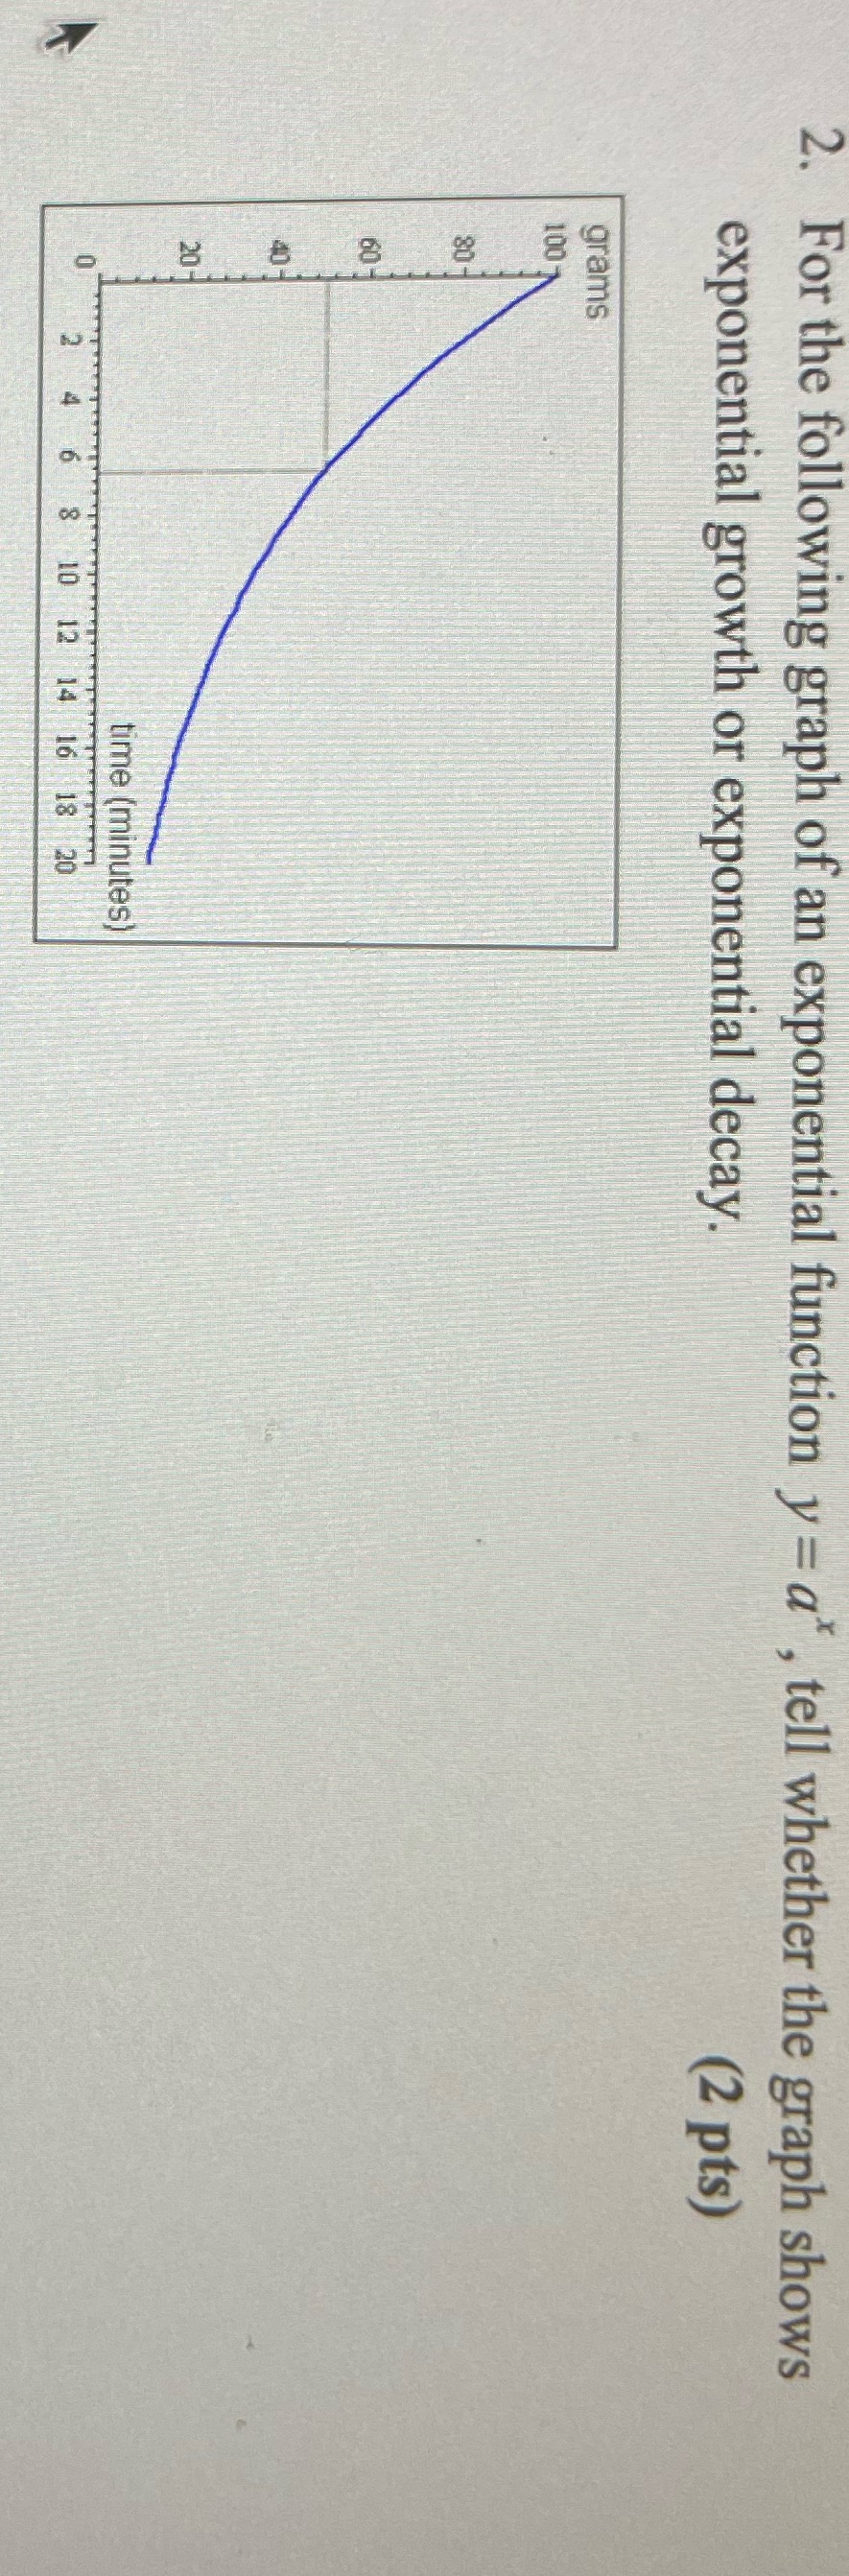

2. For the following graph of an exponential function y = a, tell whether the graph shows exponential growth or exponential decay. (2 pts) grams 8 8 8 8 8 time (minutes) 10 12 14 16 18 20
Step by Step Solution
There are 3 Steps involved in it
1 Expert Approved Answer
Step: 1 Unlock

Question Has Been Solved by an Expert!
Get step-by-step solutions from verified subject matter experts
Step: 2 Unlock
Step: 3 Unlock