

Question: The questions in this exercise are based on Target Corporation. To answer the questions, you will need to download Targets 2004 annual report (the companys
The questions in this exercise are based on Target Corporation. To answer the questions, you will need to download Target’s 2004 annual report (the company’s fiscal year ended on January 29, 2005) at http://investors.target.com/. You do not need to print the annual report to answer the questions.
Required:
- Prepare a five-year horizontal analysis of Target’s sales and earnings from continuing operations. Use 2000 as your base year and present the trended data in dollar and percentage form as illustrated on page 718 of the textbook. What insights are revealed by the data?
- Prepare a common-size balance sheet as of the fiscal years ended January 29, 2005, and January 31, 2004. Use the format shown in Exhibit 16—4 within the chapter.
- When performing a vertical analysis of its profitability does Target use sale ($45,682 for 2004) or total revenues ($46,839 for 2004)? Why? Calculate Target’s earnings per share, price-earnings ratio, dividend payout ratio, dividend yield ratio, return on total assets, return on common stockholders’ equity, and book value per share for the fiscal year ended January 29, 2005. Use earnings from continuing operations for all of your calculations. Assume that Target’s market price per share of common stock was $49.49 as of January 29, 2005.
- Calculate Target’s working capital, current ratio, acid-test ratio, inventory turnover ratio, and average sale period for the fiscal year ended January 29, 2005.
- Calculate Target’s times interest earned ratio and debt-to-equity ratio for the fiscal year ended January 29, 2005.
- Below are selected financial ratios for Wal-Mart Stores, Inc. for its fiscal year ended January 31, 2005. How does Target’s performance compare to Wal-Mart’s?
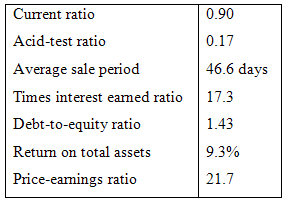
Current ratio 0.90 0.17 Acid-test ratio 46.6 days Average sale period 17.3 Times interest eamed ratio Debt-to-equity ratio 1.43 9.3% Retum on total assets Price-eamings ratio 21.7
Step by Step Solution
3.25 Rating (154 Votes )
There are 3 Steps involved in it
1 The 5year horizontal analysis in dollar and percentage form is summarized below dollar amounts are in millions 2004 2003 2002 2001 2000 Sales 45682 40928 36519 32602 29462 Earnings from continuing o... View full answer

Get step-by-step solutions from verified subject matter experts
Document Format (1 attachment)
25-B-M-A-F-S-A (10).docx
120 KBs Word File