

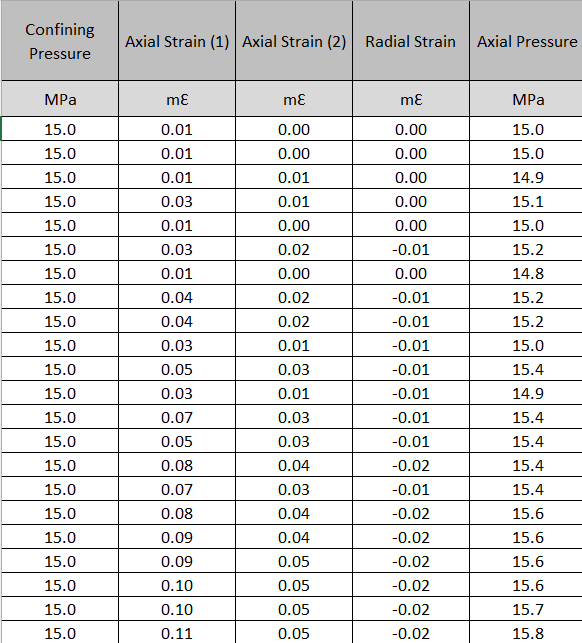
Question: 2 . For the Triaxial Compression Strength test ( TCS ) : ( 1 0 points ) ( attached a portion of the raw data
For the Triaxial Compression Strength test TCS: pointsattached a portion of the raw data
a Plot the obtained data for stress Sig versus axial and radial strains and study the elastic behavior of the tested rock. pointsHow to plot in excel? steps please
b What is the triaxial compressive strength TCS of that rock? Note that for this step you need to plot the stress difference Sig Sig versus axial and radial strains. points
c Add to your plot in step a two more stress axial strain curves that would schematically show the expected results of triaxial compression tests run at confining pressures of your choice, but greater than the one used in the lab. Indicate the confining pressure Sig value on each curve and summarize in writing what is the expected effect of confining stress increase on average Youngs modulus, TCS and postpeak behavior? Note that these curves are rough sketches and no calculation is needed. pointsHow on excel? steps please
Step by Step Solution
There are 3 Steps involved in it
1 Expert Approved Answer
Step: 1 Unlock

Question Has Been Solved by an Expert!
Get step-by-step solutions from verified subject matter experts
Step: 2 Unlock
Step: 3 Unlock