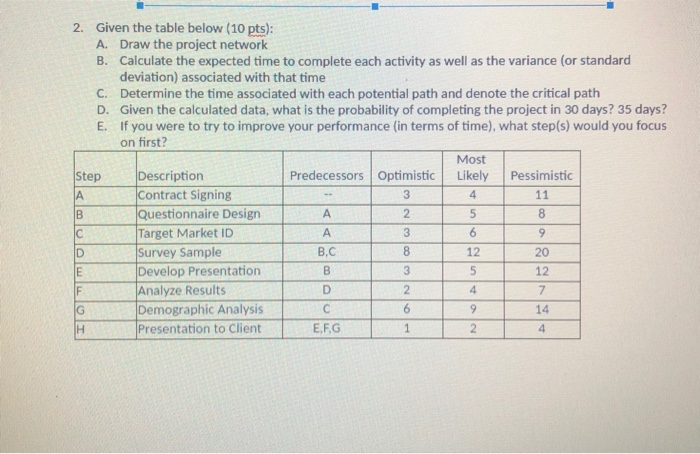
Question: 2. Given the table below (10 pts): A. Draw the project network B. Calculate the expected time to complete each activity as well as the

2. Given the table below (10 pts): A. Draw the
2. Given the table below (10 pts): A. Draw the project network B. Calculate the expected time to complete each activity as well as the variance (or standard deviation) associated with that time C. Determine the time associated with each potential path and denote the critical path D. Given the calculated data, what is the probability of completing the project in 30 days? 35 days? E. If you were to try to improve your performance (in terms of time), what step(s) would you focus on first? Most Step Description Predecessors Optimistic Likely Pessimistic A Contract Signing - 11 Questionnaire Design A 8 C Target Market IDE A D Survey Sample E Develop Presentation 12 Analyze Results Demographic Analysis Presentation to Client B 5 R 9 B

Step by Step Solution

There are 3 Steps involved in it

1 Expert Approved Answer
Step: 1 Unlock blur-text-image
Question Has Been Solved by an Expert!

Get step-by-step solutions from verified subject matter experts

Step: 2 Unlock
Step: 3 Unlock

Students Have Also Explored These Related General Management Questions!