

Question: 2. In this problem use the following and the lecture notes information to visualize data. The data can be downloaded from the web and visualized
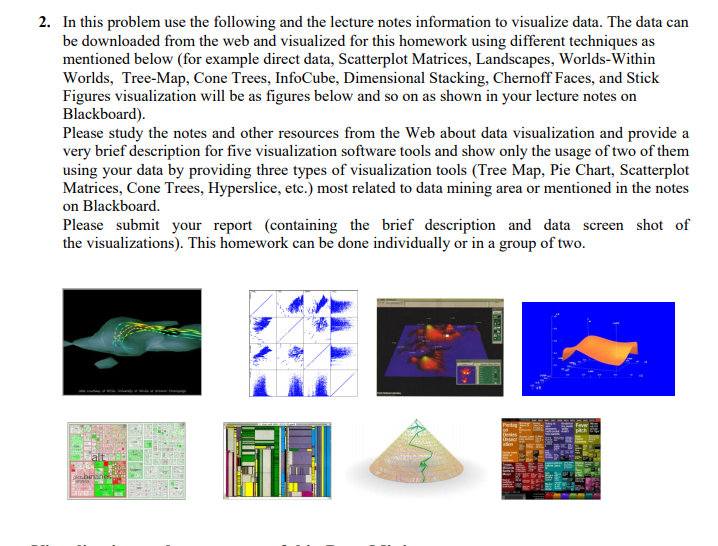
2. In this problem use the following and the lecture notes information to visualize data. The data can be downloaded from the web and visualized for this homework using different techniques as mentioned below (for example direct data, Scatterplot Matrices, Landscapes, Worlds-Within Worlds, Tree-Map, Cone Trees, InfoCube, Dimensional Stacking, Chernoff Faces, and Stick Figures visualization will be as figures below and so on as shown in your lecture notes on Blackboard) Please study the notes and other resources from the Web about data visualization and provide a very brief description for five visualization software tools and show only the usage of two of them using your data by providing three types of visualization tools (Tree Map, Pie Chart, Scatterplot Matrices, Cone Trees, Hyperslice, etc.) most related to data mining area or mentioned in the notes on Blackboard. Please submit your report (containing the brief description and data screen shot of the visualizations). This homework can be done individually or in a group of two. 2. In this problem use the following and the lecture notes information to visualize data. The data can be downloaded from the web and visualized for this homework using different techniques as mentioned below (for example direct data, Scatterplot Matrices, Landscapes, Worlds-Within Worlds, Tree-Map, Cone Trees, InfoCube, Dimensional Stacking, Chernoff Faces, and Stick Figures visualization will be as figures below and so on as shown in your lecture notes on Blackboard) Please study the notes and other resources from the Web about data visualization and provide a very brief description for five visualization software tools and show only the usage of two of them using your data by providing three types of visualization tools (Tree Map, Pie Chart, Scatterplot Matrices, Cone Trees, Hyperslice, etc.) most related to data mining area or mentioned in the notes on Blackboard. Please submit your report (containing the brief description and data screen shot of the visualizations). This homework can be done individually or in a group of two
Step by Step Solution
There are 3 Steps involved in it

Get step-by-step solutions from verified subject matter experts