

Question: 2. Learning Goal: To learn how graphis can be used to answer kinotics questions. A student collected time (t) and concentration ([A) data at 295K
2. 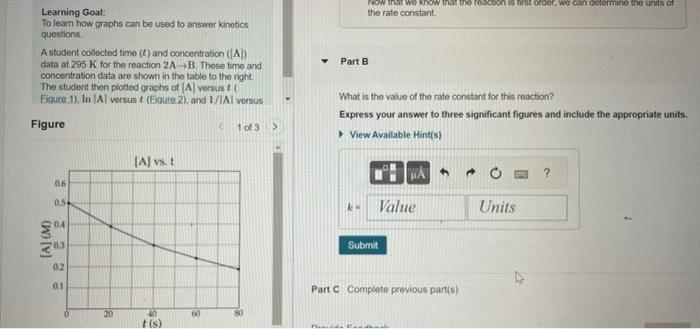
Learning Goal: To learn how graphis can be used to answer kinotics questions. A student collected time (t) and concentration ([A) data at 295K for the reaction 2AB. These time and Part B concentration data are shown in the tablo to the tight. The student then plotled grophs of [A versus t ( Equre 1), In A versus t (Egure 2), and 1/A vorsus: What is the value of the rate constant for this reaction? Express your answer to three significant figures and include the appropriate units
Step by Step Solution
There are 3 Steps involved in it
1 Expert Approved Answer
Step: 1 Unlock

Question Has Been Solved by an Expert!
Get step-by-step solutions from verified subject matter experts
Step: 2 Unlock
Step: 3 Unlock