

Question: 2. Plot a graph of moisture content(x) against time (t) in seconds using a batch drying test data given in the Table 1. From
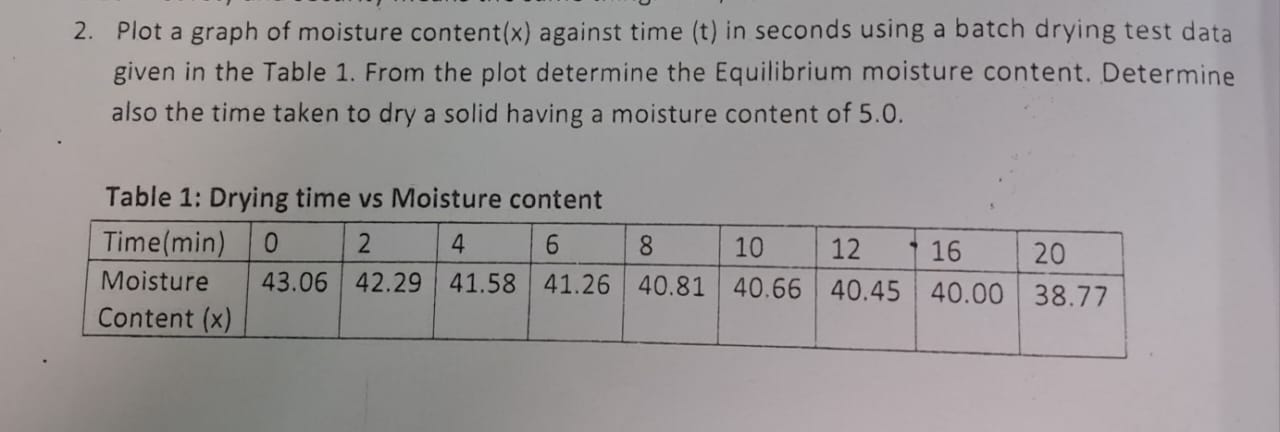
2. Plot a graph of moisture content(x) against time (t) in seconds using a batch drying test data given in the Table 1. From the plot determine the Equilibrium moisture content. Determine also the time taken to dry a solid having a moisture content of 5.0. Table 1: Drying time vs Moisture content 2 4 6 Time(min) 0 8 10 Moisture 43.06 42.29 41.58 41.26 40.81 40.66 Content (x) 12 16 40.45 40.00 20 38.77
Step by Step Solution
There are 3 Steps involved in it
1 Expert Approved Answer
Step: 1 Unlock

Question Has Been Solved by an Expert!
Get step-by-step solutions from verified subject matter experts
Step: 2 Unlock
Step: 3 Unlock