

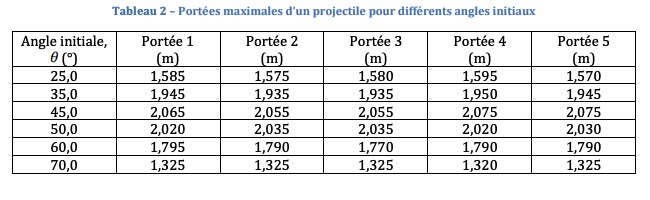
Question: 2) Projectile motion Calculation 2a: Find the average value of the range for each initial angle, ?. Graph 2: Based on the data in Table
2) Projectile motion
Calculation 2a:
Find the average value of the range for each initial angle, ?.
Graph 2:
Based on the data in Table 2, graph the average value of the maximum span versus sin(2?) for each initial angle. Used the linear regression tool on your data and be sure to show the uncertainties in the regression parameters. You must show the data table and give your graph an appropriate title.
Calculation 2b:
From the slope of the linear regression in Chart 2, calculate the experimental value of the acceleration due to gravity, ?exp.
Question 2:
Compare the experimental value of ? obtained in Calc. 2b with the accepted value of 9.81 m/s 2 using the percent error calculation. Do you think the experimental value is consistent with the accepted value. NB. %
Calculation 2c:
For an initial launch angle of ? = 60.0 and the initial velocity given in the experimental details, calculate: (i) the theoretical time for the projectile to reach its maximum height. (ii) the theoretical maximum height above the launch point. (iii) the theoretical maximum range that the projectile would reach NB. You should use the theoretical value of ? = 9.81 m/s 2 and you can assume that the initial and final heights are the same. Do not worry about the sign convention for ?.
Step by Step Solution
There are 3 Steps involved in it

Get step-by-step solutions from verified subject matter experts