

Question: ( 2 pts ) In the python notebook file python _ play.ipynb, consider the code in the following cell:fig, axes = plt . subplots (
pts
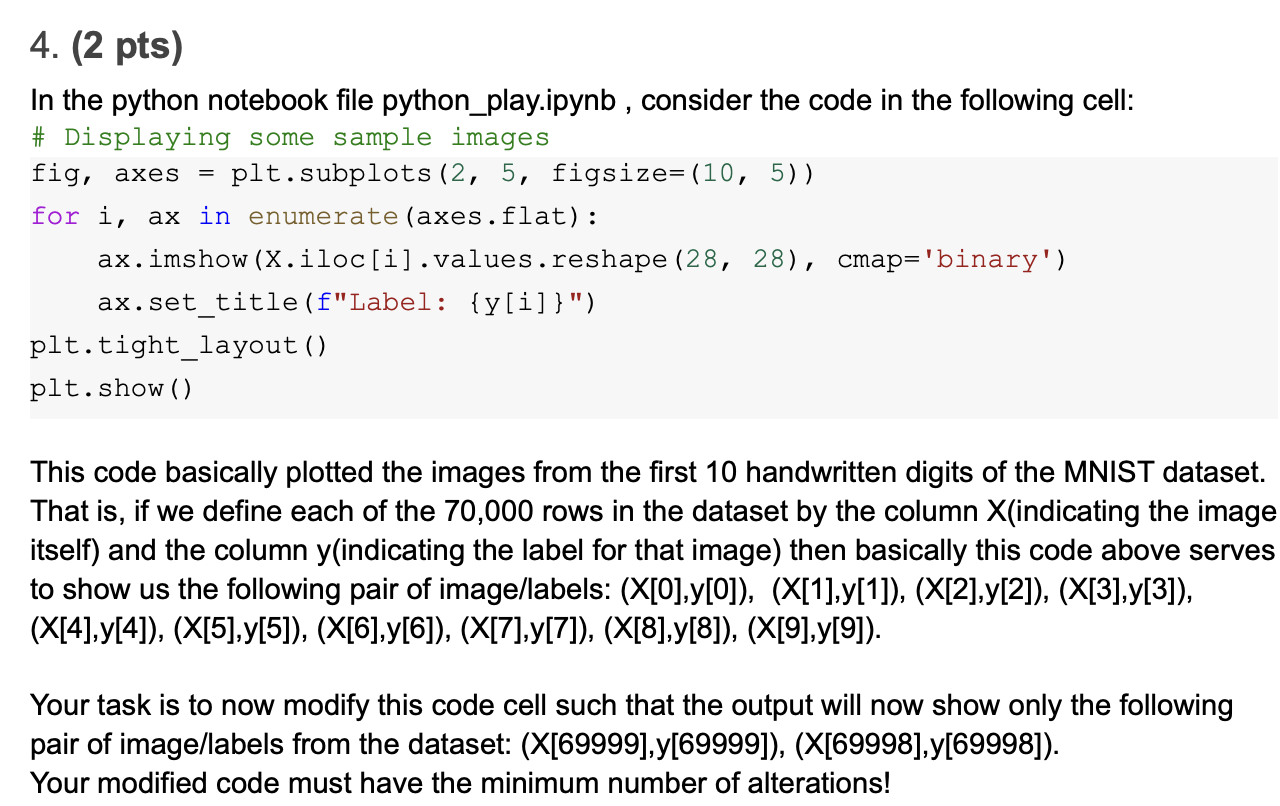
In the python notebook file pythonplay.ipynb, consider the code in the following cell:fig, axes pltsubplots figsize
for i ax in enumerateaxesflat:axsettitlefLabel: yi
plttightlayout
pltshowThis code basically plotted the images from the first handwritten digits of the MNIST dataset.
That is if we define each of the rows in the dataset by the column indicating the image
itself and the column yindicating the label for that image then basically this code above serves
to show us the following pair of imagelabels: XyXyXyXy
XyXyXyXyXyXy
Your task is to now modify this code cell such that the output will now show only the following
pair of imagelabels from the dataset: XyXy
Your modified code must have the minimum number of alterations!
Step by Step Solution
There are 3 Steps involved in it
1 Expert Approved Answer
Step: 1 Unlock

Question Has Been Solved by an Expert!
Get step-by-step solutions from verified subject matter experts
Step: 2 Unlock
Step: 3 Unlock