Question: 2 Store D i l E O M E A A T 2 Pivot Table Recommended Pivot Tables Table Pictures Shapes SmartArt Screenshot My Add-ins
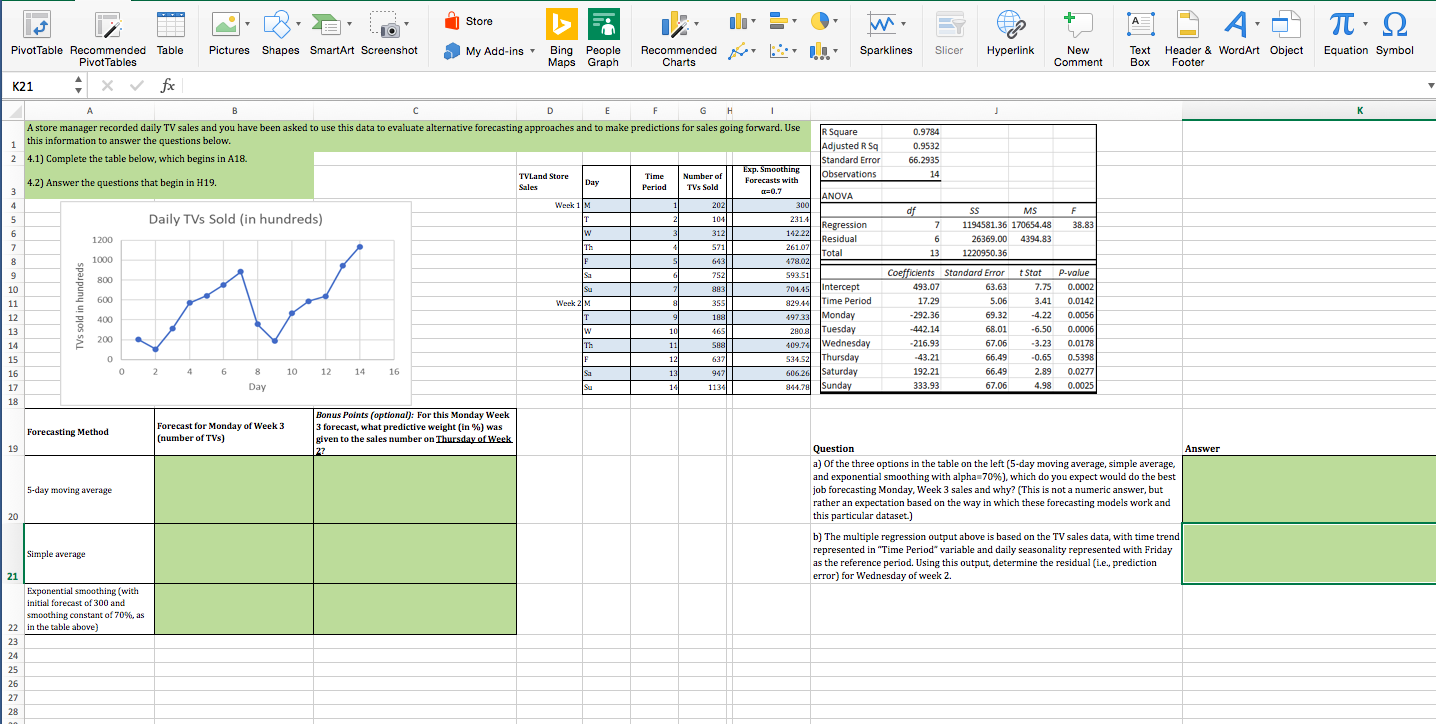
2 Store D i l E O M E A A T 2 Pivot Table Recommended Pivot Tables Table Pictures Shapes SmartArt Screenshot My Add-ins Bing People Maps Graph Recommended Charts B Sparklines Slicer Hyperlink New Comment Text Header & WordArt Object Box Footer Equation Symbol K21 , x vfx 0.9784 0.9532 66.2935 14 df F 38.83 D E F G H I A store manager recorded daily TV sales and you have been asked to use this data to evaluate alternative forecasting approaches and to make predictions for sales going forward. Use this information to answer the questions below. R Square Adjusted RSQ 4.1) Complete the table below, which begins in A18. Standard Error Exp. Smoothing TV Land Store Time Number of 4.2) Answer the questions that begin in H19. Observations Day Forecasts with Sales Period TVs Sold =0.7 ANOVA Week 1M 2021 300 Daily TVs Sold (in hundreds) 1041 231.4 Regression W 312|| 142.221 Residual 57 26107 Total F 643|| 478021 752|| 593 51 Su 21 883| 704,451 Intercept Week 2M 3551 829.44 Time Period T 9 1880 49733 Monday w 4651 280.81 Tuesday IT 588 409.74 Wednesday 126371 534 521 Thursday 0 2 4 6 8 10 12 14 16 13947 606.26 Saturday Day 141134 844.78 Sunday 7 6 13 SSM S 1194581.36 170654.48 26369.00 4394.83 1 220950.36 TVs sold in hundreds Coefficients 493.07 17.29 -292.36 -442.14 -216.93 -43.21 192.21 333.93 Standard Error 63.63 5.06 69.32 68.01 67.06 66.49 10 Stat 7.75 3.41 -4.22 -6.50 -3.23 -0.65 2.89 4.98 P-value 0.0002 0.0142 0.0056 0.0006 0.0178 0.5398 0.0277 0.0025 67.06 Forecasting Method Forecast for Monday of Week 3 (number of TVs) Bonus Points (optional): For this Monday Week 3 forecast, what predictive weight (in %) was given to the sales number on Thursday of Week Answer 5-day moving average Question a) of the three options in the table on the left (5-day moving average, simple average, and exponential smoothing with alpha=70%), which do you expect would do the best job forecasting Monday, Week 3 sales and why? (This is not a numeric answer, but rather an expectation based on the way in which these forecasting models work and this particular dataset.) b) The multiple regression output above is based on the TV sales data, with time trend represented in "Time Period variable and daily seasonality represented with Friday as the reference period. Using this output, determine the residual (i.e, prediction error) for Wednesday of week 2 Simple average Exponential smoothing (with initial forecast of 300 and smoothing constant of 70%, as in the table above) 2 Store D i l E O M E A A T 2 Pivot Table Recommended Pivot Tables Table Pictures Shapes SmartArt Screenshot My Add-ins Bing People Maps Graph Recommended Charts B Sparklines Slicer Hyperlink New Comment Text Header & WordArt Object Box Footer Equation Symbol K21 , x vfx 0.9784 0.9532 66.2935 14 df F 38.83 D E F G H I A store manager recorded daily TV sales and you have been asked to use this data to evaluate alternative forecasting approaches and to make predictions for sales going forward. Use this information to answer the questions below. R Square Adjusted RSQ 4.1) Complete the table below, which begins in A18. Standard Error Exp. Smoothing TV Land Store Time Number of 4.2) Answer the questions that begin in H19. Observations Day Forecasts with Sales Period TVs Sold =0.7 ANOVA Week 1M 2021 300 Daily TVs Sold (in hundreds) 1041 231.4 Regression W 312|| 142.221 Residual 57 26107 Total F 643|| 478021 752|| 593 51 Su 21 883| 704,451 Intercept Week 2M 3551 829.44 Time Period T 9 1880 49733 Monday w 4651 280.81 Tuesday IT 588 409.74 Wednesday 126371 534 521 Thursday 0 2 4 6 8 10 12 14 16 13947 606.26 Saturday Day 141134 844.78 Sunday 7 6 13 SSM S 1194581.36 170654.48 26369.00 4394.83 1 220950.36 TVs sold in hundreds Coefficients 493.07 17.29 -292.36 -442.14 -216.93 -43.21 192.21 333.93 Standard Error 63.63 5.06 69.32 68.01 67.06 66.49 10 Stat 7.75 3.41 -4.22 -6.50 -3.23 -0.65 2.89 4.98 P-value 0.0002 0.0142 0.0056 0.0006 0.0178 0.5398 0.0277 0.0025 67.06 Forecasting Method Forecast for Monday of Week 3 (number of TVs) Bonus Points (optional): For this Monday Week 3 forecast, what predictive weight (in %) was given to the sales number on Thursday of Week Answer 5-day moving average Question a) of the three options in the table on the left (5-day moving average, simple average, and exponential smoothing with alpha=70%), which do you expect would do the best job forecasting Monday, Week 3 sales and why? (This is not a numeric answer, but rather an expectation based on the way in which these forecasting models work and this particular dataset.) b) The multiple regression output above is based on the TV sales data, with time trend represented in "Time Period variable and daily seasonality represented with Friday as the reference period. Using this output, determine the residual (i.e, prediction error) for Wednesday of week 2 Simple average Exponential smoothing (with initial forecast of 300 and smoothing constant of 70%, as in the table above)


