

Question: Et Get Add-ins able Recommended Pivot Tables Table Illustrations BX ka line Recommended Charts D My Add-ins Maps PivotChart i Column Tables 3D Map Add-ins
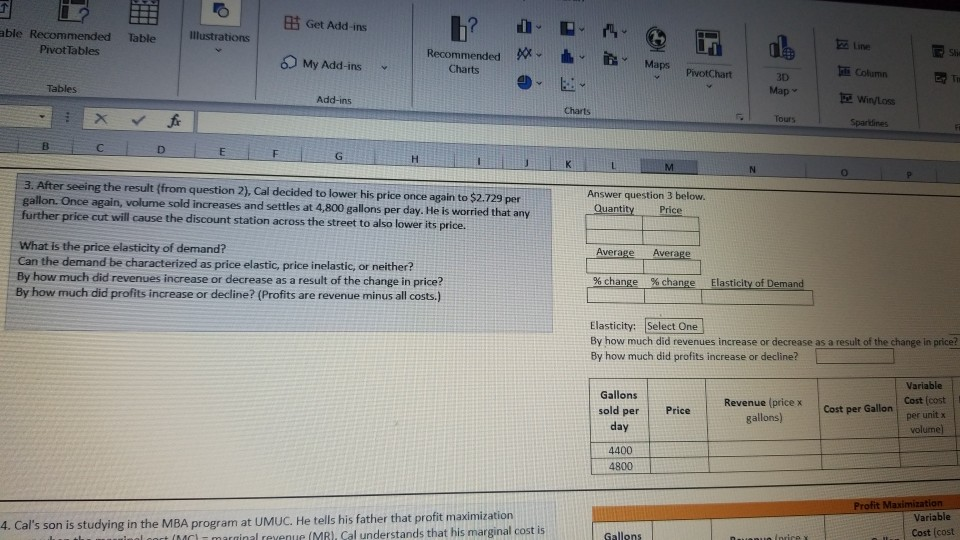
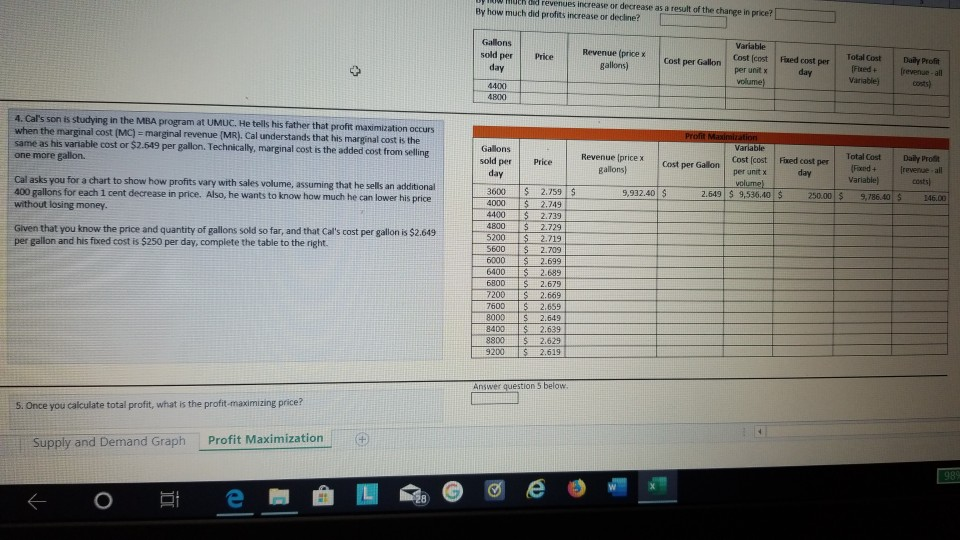
Et Get Add-ins able Recommended Pivot Tables Table Illustrations BX ka line Recommended Charts D My Add-ins Maps PivotChart i Column Tables 3D Map Add-ins 2 Windless Charts Tours Spardines BTC D E F G H J 3. After seeing the result (from question 2), Cal decided to lower his price once again to $2.729 per gallon. Once again, volume sold increases and settles at 4,800 gallons per day. He is worried that any further price cut will cause the discount station across the street to also lower its price. Answer question 3 below. Quantity Price Average Average What is the price elasticity of demand? Can the demand be characterized as price elastic, price inelastic, or neither? By how much did revenues increase or decrease as a result of the change in price? By how much did profits increase or decline? (Profits are revenue minus all costs.) % change % change Elasticity of Demand Elasticity: Select One By how much did revenues increase or decrease as a result of the change in price? By how much did profits increase or decline? Gallons sold per day Price Revenue (pricex gallons) Cost per Gallon Variable Cost (cost per unit x volume) 4400 4800 4. Cal's son is studying in the MBA program at UMUC. He tells his father that profit maximization al cort (MCI - marminal revenue (MR). Cal understands that his marginal cost is Profit Maximization Variable Cost (cost Gallons liray V W MUCROd revenues increase or decrease as a result of the change in price? By how much did profits increase or decline? Gallons sold per day Price Revenue (pricex gallons) Cost per Gallon Variable Cost cost per unit volume) Fred cost per day Total Cost Fred Variable) Daily Profit revenue-all 4800 4. Cal's son is studying in the MBA program at UMUC. He tells his father that profit maximization occurs when the marginal cost (MC) = marginal revenue (MR). Cal understands that his marginal cost is the same as his variable cost or $2.549 per gallon. Technically, marginal cost is the added cost from selling one more gallon. Cal asks you for a chart to show how profits vary with sales volume, assuming that he sells an additional 400 gallons for each 1 cent decrease in price. Also, he wants to know how much he can lower his price without losing money. Total Cost Daily Profit Fred cost per + revenue all day Variable) $ 250.00 $ 9,786.40 $ 146.00 Given that you know the price and quantity of gallons sold so far, and that Cal's cost per gallon is $2.649 per gallon and his fried cost is $250 per day, complete the table to the right. Profil Maximization Variable Gallons sold per Price Revenue (pricex Cost per Gallon Cost cost gallons) day per unit x volume) 3600 $ 2.759 $ 9,932.40 $ 2.649 $ 9,536.40 4000 $ 2.749 4400 $ 2.739 4800 $ 2.729 5200S 2 .719 5600 $ 2.709 6000 TS 2.699 6400 IS 2.689 6800 IS 2.679 7200 IS 2.669 7500 $ 9000 S 2.649 8400 IS 2.639 8800 $ 2.629 9200 S2.619 Answer questions below 5. Once you calculate total profit, what is the profit maximizing price? Supply and Demand Graph Profit Maximization E o B e L e o Et Get Add-ins able Recommended Pivot Tables Table Illustrations BX ka line Recommended Charts D My Add-ins Maps PivotChart i Column Tables 3D Map Add-ins 2 Windless Charts Tours Spardines BTC D E F G H J 3. After seeing the result (from question 2), Cal decided to lower his price once again to $2.729 per gallon. Once again, volume sold increases and settles at 4,800 gallons per day. He is worried that any further price cut will cause the discount station across the street to also lower its price. Answer question 3 below. Quantity Price Average Average What is the price elasticity of demand? Can the demand be characterized as price elastic, price inelastic, or neither? By how much did revenues increase or decrease as a result of the change in price? By how much did profits increase or decline? (Profits are revenue minus all costs.) % change % change Elasticity of Demand Elasticity: Select One By how much did revenues increase or decrease as a result of the change in price? By how much did profits increase or decline? Gallons sold per day Price Revenue (pricex gallons) Cost per Gallon Variable Cost (cost per unit x volume) 4400 4800 4. Cal's son is studying in the MBA program at UMUC. He tells his father that profit maximization al cort (MCI - marminal revenue (MR). Cal understands that his marginal cost is Profit Maximization Variable Cost (cost Gallons liray V W MUCROd revenues increase or decrease as a result of the change in price? By how much did profits increase or decline? Gallons sold per day Price Revenue (pricex gallons) Cost per Gallon Variable Cost cost per unit volume) Fred cost per day Total Cost Fred Variable) Daily Profit revenue-all 4800 4. Cal's son is studying in the MBA program at UMUC. He tells his father that profit maximization occurs when the marginal cost (MC) = marginal revenue (MR). Cal understands that his marginal cost is the same as his variable cost or $2.549 per gallon. Technically, marginal cost is the added cost from selling one more gallon. Cal asks you for a chart to show how profits vary with sales volume, assuming that he sells an additional 400 gallons for each 1 cent decrease in price. Also, he wants to know how much he can lower his price without losing money. Total Cost Daily Profit Fred cost per + revenue all day Variable) $ 250.00 $ 9,786.40 $ 146.00 Given that you know the price and quantity of gallons sold so far, and that Cal's cost per gallon is $2.649 per gallon and his fried cost is $250 per day, complete the table to the right. Profil Maximization Variable Gallons sold per Price Revenue (pricex Cost per Gallon Cost cost gallons) day per unit x volume) 3600 $ 2.759 $ 9,932.40 $ 2.649 $ 9,536.40 4000 $ 2.749 4400 $ 2.739 4800 $ 2.729 5200S 2 .719 5600 $ 2.709 6000 TS 2.699 6400 IS 2.689 6800 IS 2.679 7200 IS 2.669 7500 $ 9000 S 2.649 8400 IS 2.639 8800 $ 2.629 9200 S2.619 Answer questions below 5. Once you calculate total profit, what is the profit maximizing price? Supply and Demand Graph Profit Maximization E o B e L e o
Step by Step Solution
There are 3 Steps involved in it
1 Expert Approved Answer
Step: 1 Unlock

Question Has Been Solved by an Expert!
Get step-by-step solutions from verified subject matter experts
Step: 2 Unlock
Step: 3 Unlock