

Question: 5. HOME FILE 2.: INSERT QuickBooks Financial Sta 2 3 Pivot Table Recommended Pivot Tables Tables 2 Table PAGE LAYOUT FORMULAS DATA REVIEW VIEW Store
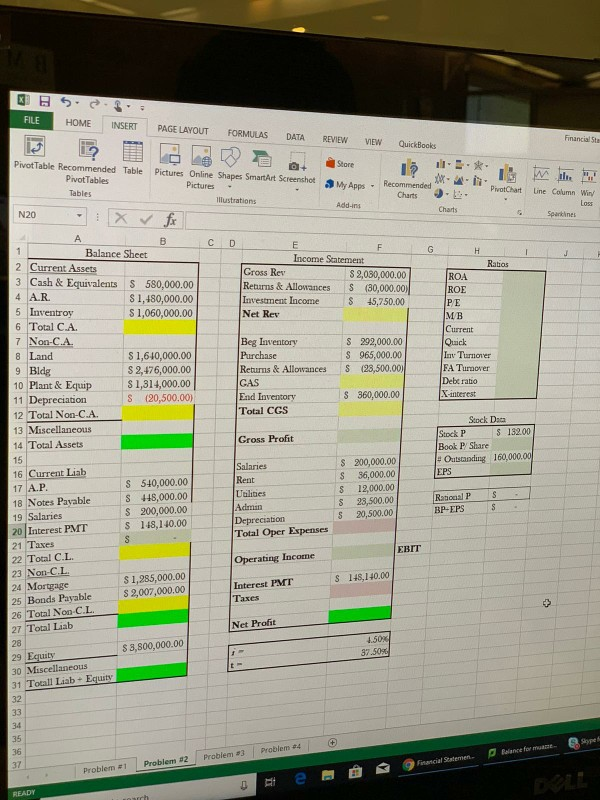
5. HOME FILE 2.: INSERT QuickBooks Financial Sta 2 3 Pivot Table Recommended Pivot Tables Tables 2 Table PAGE LAYOUT FORMULAS DATA REVIEW VIEW Store Pictures Online Shapes SmartArt Screenshot am Pictures - Illustrations Add-ins m My Apps - Recommende Charts PivotChart al Une Column Win Loss Sparklines Charts C D Rabos E Income Statement Cross Rev $ 2,080,000.00 Returns & Allowances S (30,000.00 Investment Income $ 45,750.00 Net Rev ROA ROE PE $ S S 292,000.00 965,000.00 (23,500.00) MB Current Quick La Turnover FA Tungover Debe ratio X-interest Beg Inventory Purchase Returns & Allowances GAS End Inventory Total CGS S N20 - X fr B 1 Balance Sheet 2 Current Assets 3 Cash & Equivalents $ 580,000.00 4 AR $ 1,480,000.00 5 Inventroy $ 1,060,000.00 6 Total C.A. 7 Non-C.A. 8 Land S 1,610,000.00 9 Bldg S 2,476,000.00 10 Plant & Equip $ 1,314,000.00 11 Depreciation S (20,500.00) 12 Total Non-C.A. 13 Miscellaneous 14 Total Assets 15 16 Current Liab 17 A.P. S 540,000.00 18 Notes Payable S 448,000.00 19 Salaries S 200,000.00 $ 148,140.00 20 Interest PMT 21 Taxes 22 Total C.L. 23 Non-CL 24 Mortgage $ 1,285,000.00 $ 2,007,000.00 25 Bonds Payable 26 Total Non-CL 360,000.00 Gross Profit Stock Daca Stock P S 132.00 Book P Share Outstanding 160,000.00 EPS Salaries Rent $ S $ $ S 200,000.00 36,000.00 12,000.00 23,500.00 20,500.00 S Lilities Admin Depreciation Total Oper Expenses - Rational P BPLFPSS EBIT Operating Income $ 148,140.00 Interest PMT Taxes 27 Total Liab Net Profit $ 3,800,000.00 97.5093 29 Equity 30 Miscellaneous 31 Totall Liab - Equity ye 3 Problem 24 Problem Problem Rolane for me 2 a l Statemen. Problem DE2 M 5. HOME FILE 2.: INSERT QuickBooks Financial Sta 2 3 Pivot Table Recommended Pivot Tables Tables 2 Table PAGE LAYOUT FORMULAS DATA REVIEW VIEW Store Pictures Online Shapes SmartArt Screenshot am Pictures - Illustrations Add-ins m My Apps - Recommende Charts PivotChart al Une Column Win Loss Sparklines Charts C D Rabos E Income Statement Cross Rev $ 2,080,000.00 Returns & Allowances S (30,000.00 Investment Income $ 45,750.00 Net Rev ROA ROE PE $ S S 292,000.00 965,000.00 (23,500.00) MB Current Quick La Turnover FA Tungover Debe ratio X-interest Beg Inventory Purchase Returns & Allowances GAS End Inventory Total CGS S N20 - X fr B 1 Balance Sheet 2 Current Assets 3 Cash & Equivalents $ 580,000.00 4 AR $ 1,480,000.00 5 Inventroy $ 1,060,000.00 6 Total C.A. 7 Non-C.A. 8 Land S 1,610,000.00 9 Bldg S 2,476,000.00 10 Plant & Equip $ 1,314,000.00 11 Depreciation S (20,500.00) 12 Total Non-C.A. 13 Miscellaneous 14 Total Assets 15 16 Current Liab 17 A.P. S 540,000.00 18 Notes Payable S 448,000.00 19 Salaries S 200,000.00 $ 148,140.00 20 Interest PMT 21 Taxes 22 Total C.L. 23 Non-CL 24 Mortgage $ 1,285,000.00 $ 2,007,000.00 25 Bonds Payable 26 Total Non-CL 360,000.00 Gross Profit Stock Daca Stock P S 132.00 Book P Share Outstanding 160,000.00 EPS Salaries Rent $ S $ $ S 200,000.00 36,000.00 12,000.00 23,500.00 20,500.00 S Lilities Admin Depreciation Total Oper Expenses - Rational P BPLFPSS EBIT Operating Income $ 148,140.00 Interest PMT Taxes 27 Total Liab Net Profit $ 3,800,000.00 97.5093 29 Equity 30 Miscellaneous 31 Totall Liab - Equity ye 3 Problem 24 Problem Problem Rolane for me 2 a l Statemen. Problem DE2 M
Step by Step Solution
There are 3 Steps involved in it

Get step-by-step solutions from verified subject matter experts