

Question: 2. The compression factor data for a real gas is shown in Fig. 2 (next page) in terms of Z vs. pressure (in units of
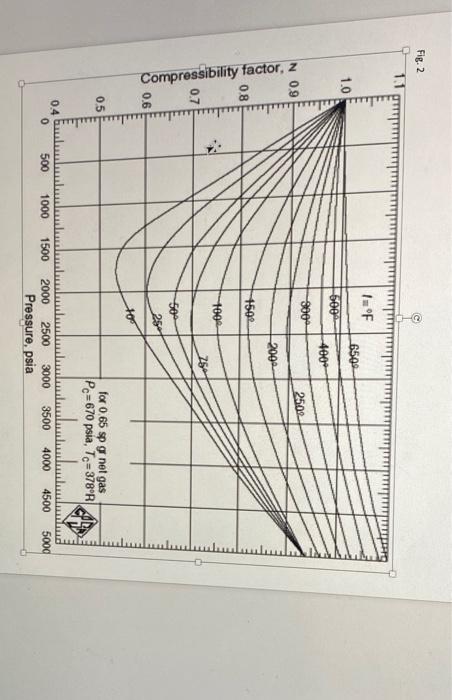
2. The compression factor data for a real gas is shown in Fig. 2 (next page) in terms of Z vs. pressure (in units of psi). Answer the following questions. Note that psia in Fig. 2 is same as psi in our lecture note.
(a) (5 pt) Determine the second virial coefficients B in units of atm-1 at T = 10, 25, 50, 75, and 100 oF.
(c) (5 pt) Here we fit the above 5 second virial coefficients with the following equation: BRT = + /T for this real gas, where and are constants, and R is the gas constant. First you plot BRT vs. 1/T, and then estimate the value from your plot. Briefly explain your estimation. Note that your units should be atm, L, K and/or mole in this question.
(d) (2 pt) What is the units of in terms of atm, L, K and/or mole?
Step by Step Solution
There are 3 Steps involved in it
1 Expert Approved Answer
Step: 1 Unlock

Question Has Been Solved by an Expert!
Get step-by-step solutions from verified subject matter experts
Step: 2 Unlock
Step: 3 Unlock