

Question: 2. The experimental data for a batch reaction showing the rate of decomposition of N204 with time are given in TABLE Q2. Based on the
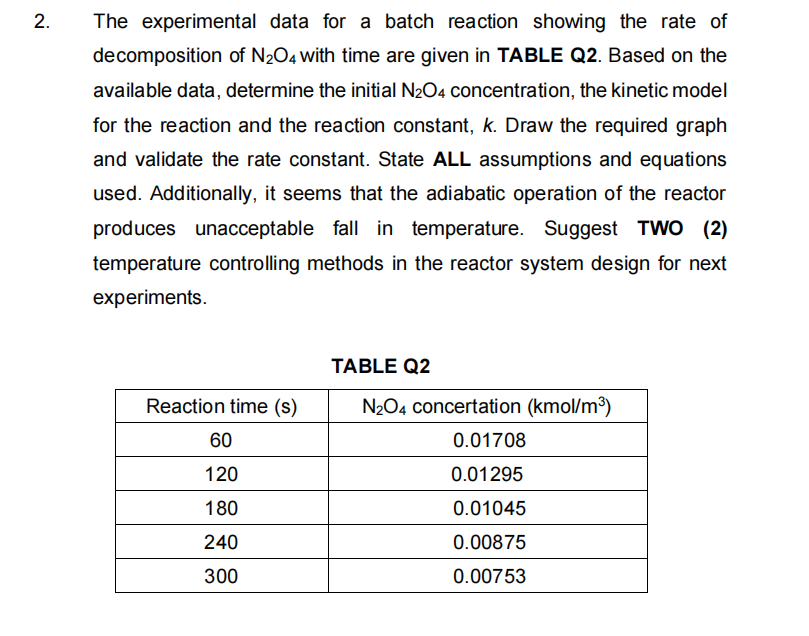
2. The experimental data for a batch reaction showing the rate of decomposition of N204 with time are given in TABLE Q2. Based on the available data, determine the initial N2O4 concentration, the kinetic model for the reaction and the reaction constant, k. Draw the required graph and validate the rate constant. State ALL assumptions and equations used. Additionally, it seems that the adiabatic operation of the reactor produces unacceptable fall in temperature. Suggest TWO (2) temperature controlling methods in the reactor system design for next experiments. TABLE Q2 Reaction time (s) 60 N204 concertation (kmol/m) 0.01708 120 0.01295 180 0.01045 240 0.00875 300 0.00753
Step by Step Solution
There are 3 Steps involved in it

Get step-by-step solutions from verified subject matter experts