

Question: 2. The following data is the average temperatures in relevant units for some cities in Canada. 35,60,15,64,55,72,49,38,65,65,45,38,22,50,48,68,72,34,62,58 a. Use the data to complete the table
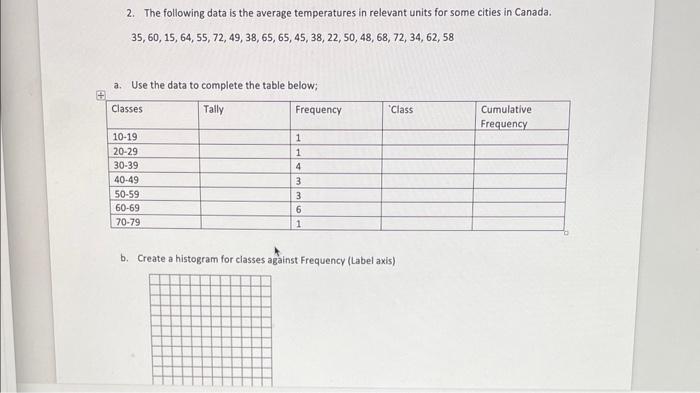
2. The following data is the average temperatures in relevant units for some cities in Canada. 35,60,15,64,55,72,49,38,65,65,45,38,22,50,48,68,72,34,62,58 a. Use the data to complete the table below; b. Create a histogram for classes against Frequency (Label axis)
Step by Step Solution
There are 3 Steps involved in it
1 Expert Approved Answer
Step: 1 Unlock

Question Has Been Solved by an Expert!
Get step-by-step solutions from verified subject matter experts
Step: 2 Unlock
Step: 3 Unlock