

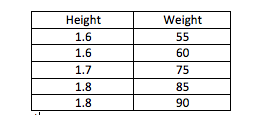
Question: 2) The following sample was drawn from guests at a party: Make a scatterplot of the data, and plot the regression line in the scatterplot
2) The following sample was drawn from guests at a party:
Make a scatterplot of the data, and plot the regression line in the scatterplot (include this graph in your answer). Then answer the following questions:
a) Would it make more sense to have height or weight as the dependent variable if you run a regression? Why? Is there a difference?
b) Run a regression, write down the regression equation and interpret the coefficients.
c) Where is the intercept on that graph, and how can it be interpreted?
d) Where can I find the regression coefficient in that graph?
e) Person A's height is 1.75m, what is his predicted weight? Person B's height is 1.5, what is his predicted weight? In which prediction do you have more confidence?
\f
Step by Step Solution
There are 3 Steps involved in it

Get step-by-step solutions from verified subject matter experts