

Question: 2. The following table provides approximate statistics on per capita income levels and growth rates for regions defined by income levels. According to the Rule
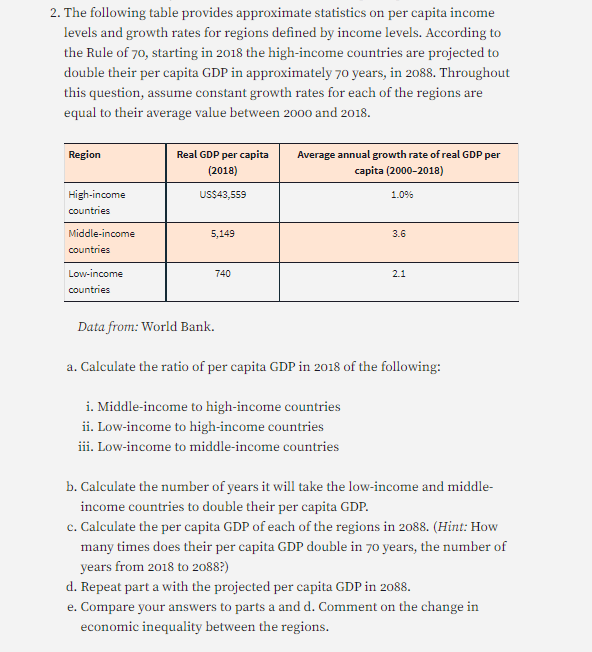
2. The following table provides approximate statistics on per capita income levels and growth rates for regions defined by income levels. According to the Rule of 70, starting in 2018 the high-income countries are projected to double their per capita GDP in approximately 70 years, in 2088. Throughout this question, assume constant growth rates for each of the regions are equal to their average value between 2000 and 2018. Region Real GDP per capita Average annual growth rate of real GDP per (2018) capita (2000-2018) High-income US$43,559 1.0% countries Middle-income 5,149 3.6 countries Low-income 740 2.1 countries Data from: World Bank. a. Calculate the ratio of per capita GDP in 2018 of the following: i. Middle-income to high-income countries ii. Low-income to high-income countries iii. Low-income to middle-income countries b. Calculate the number of years it will take the low-income and middle- income countries to double their per capita GDP. c. Calculate the per capita GDP of each of the regions in 2088. (Hint: How many times does their per capita GDP double in 70 years, the number of years from 2018 to 2088?) d. Repeat part a with the projected per capita GDP in 2088. e. Compare your answers to parts a and d. Comment on the change in economic inequality between the regions
Step by Step Solution
There are 3 Steps involved in it

Get step-by-step solutions from verified subject matter experts