

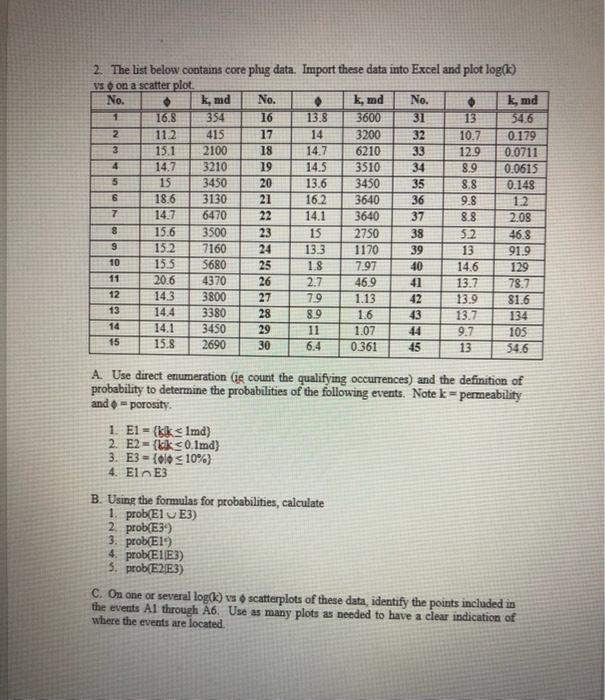
Question: 2. The list below contains core plug data. Import these data into Excel and plot log(k) vs on a scatter plot. No. k, md No.
Step by Step Solution
There are 3 Steps involved in it
1 Expert Approved Answer
Step: 1 Unlock

Question Has Been Solved by an Expert!
Get step-by-step solutions from verified subject matter experts
Step: 2 Unlock
Step: 3 Unlock