

Question: *2. Use the figure for the question(s) below. Consider the following graph of the security market line: Average excess return (%) 12 10 8 6
*2. Use the figure for the question(s) below. Consider the following graph of the security market line: Average excess return (%) 12 10 8 6 4 2 Portfolio "D": Portfolio "A" Portfolio "C" Portfolio "D" 1 Portfolio "B" Market Portfolio OA. has a negative alpha. B. offers an expected return equal to the risk - free rate. C. is overpriced. D. falls below the SML. 2 Beta
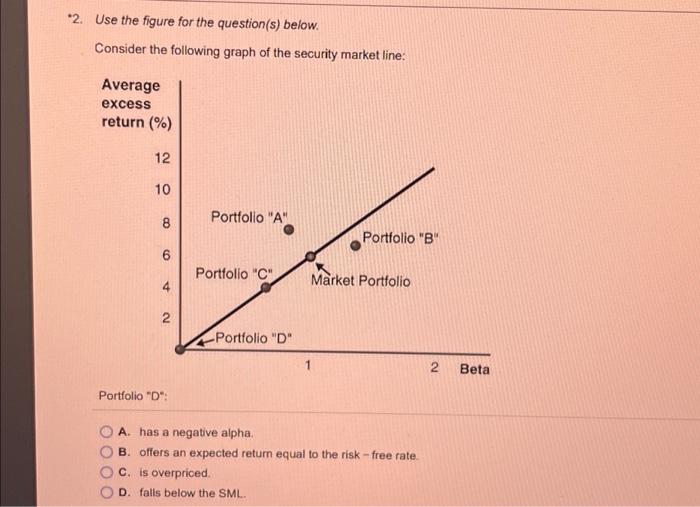
2. Use the figure for the question(s) below. Consider the following graph of the security market line: r Portfolio \"D\": A. has a negative alpha. B. offers an expected retum equal to the risk - free rate. C. is overpriced. D. falls below the SML. 2. Use the figure for the question(s) below. Consider the following graph of the security market line: r Portfolio \"D\": A. has a negative alpha. B. offers an expected retum equal to the risk - free rate. C. is overpriced. D. falls below the SML
Step by Step Solution
There are 3 Steps involved in it
1 Expert Approved Answer
Step: 1 Unlock

Question Has Been Solved by an Expert!
Get step-by-step solutions from verified subject matter experts
Step: 2 Unlock
Step: 3 Unlock