

Question: 2.) Use the given data to construct a histogram for the data.. Twenty-six couples were asked how many children they had. Number of Frequency Children
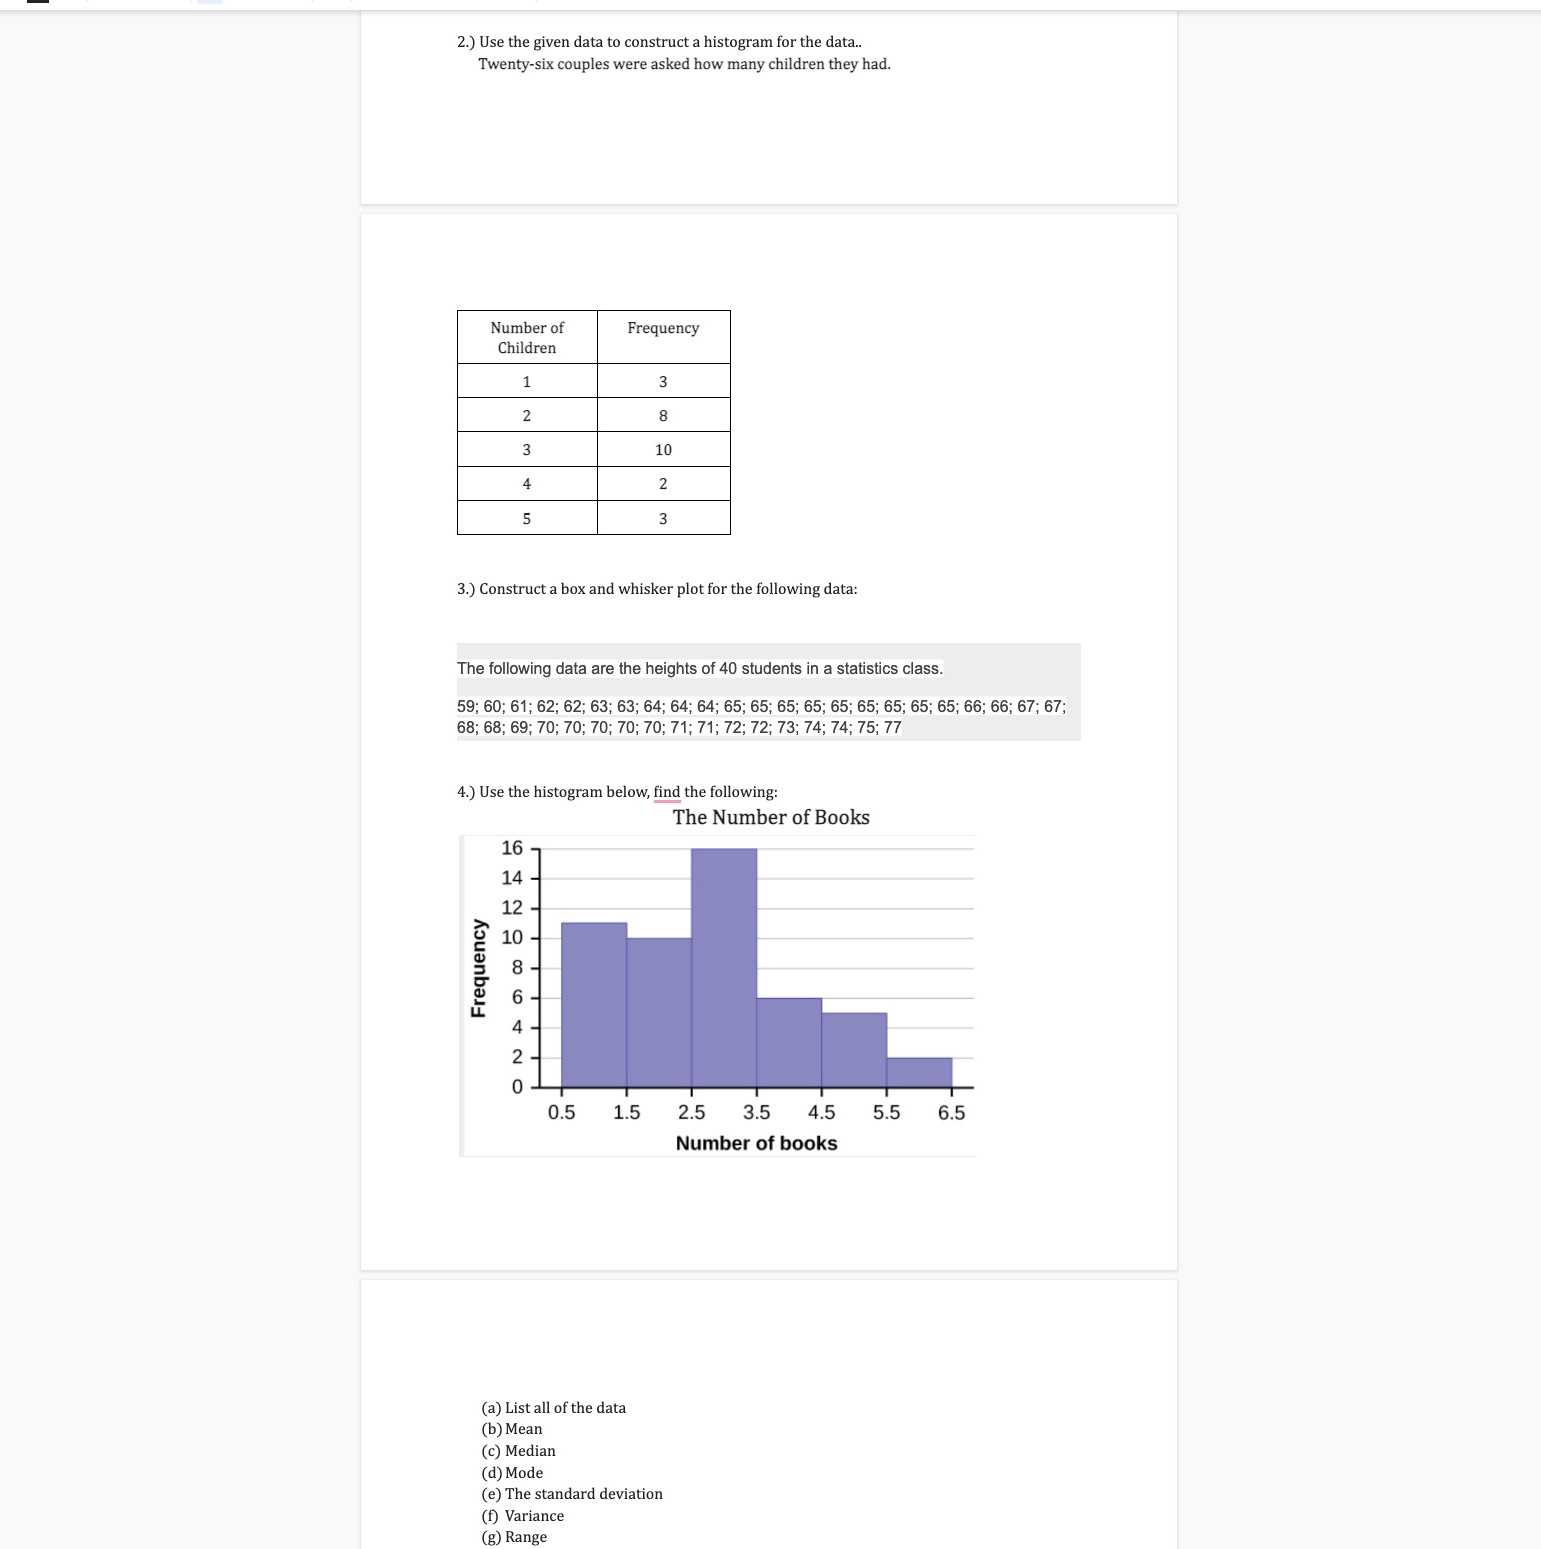
2.) Use the given data to construct a histogram for the data.. Twenty-six couples were asked how many children they had. Number of Frequency Children 1 3 2 B 3 10 4 2 5 3 3.) Construct a box and whisker plot for the following data: The following data are the heights 0140 students in a statistics class. 59; 50; 61:52; 52; 63; 63; 54; 64; 64; 55; 55; 55; 55; 55; 55; 55; 55; 65; 55; 56; 67; 67; 58; 63; 69: T0; 70; 7D: 70; 70; 71; 71; 72; 72; 73; T4; 74; 75; 73" 4.) Use the histogram below, w the following: The Number of Books Frequency ._. o 0.5 1.5 2.5 3.5 4.5 5.5 6.5 Number of books (a) List all ofthe data (b) Mean (c) Median (d) Mode (e) The standard deviation (1') Variance (g) Range
Step by Step Solution
There are 3 Steps involved in it

Get step-by-step solutions from verified subject matter experts