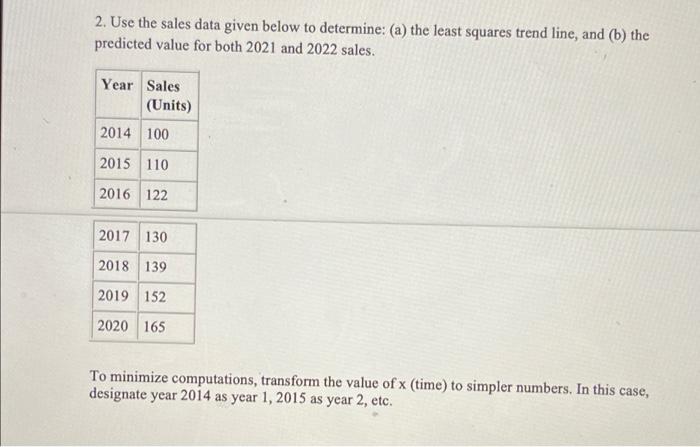
Question: 2. Use the sales data given below to determine: (a) the least squares trend line, and (b) the predicted value for both 2021 and 2022

2. Use the sales data given below to determine:
2. Use the sales data given below to determine: (a) the least squares trend line, and (b) the predicted value for both 2021 and 2022 sales. Year Sales (Units) 2014 100 2015 110 2016 122 2017 130 2018 139 2019 152 2020 165 To minimize computations, transform the value of x (time) to simpler numbers. In this case, designate year 2014 as year 1, 2015 as year 2, etc

Step by Step Solution

There are 3 Steps involved in it

1 Expert Approved Answer
Step: 1 Unlock blur-text-image
Question Has Been Solved by an Expert!

Get step-by-step solutions from verified subject matter experts

Step: 2 Unlock
Step: 3 Unlock

Students Have Also Explored These Related General Management Questions!