

Question: 2. Using the following data to compute the limits for x and s charts. Is the process still in control? Note: calculate the control limits
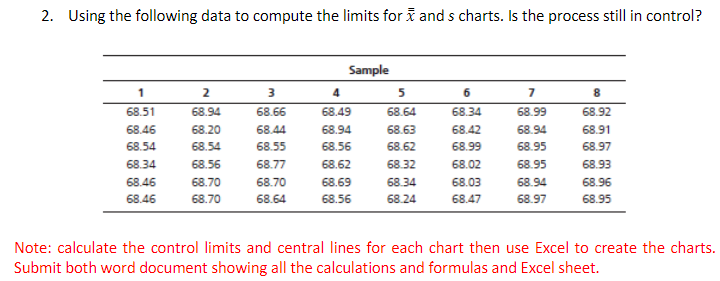
2. Using the following data to compute the limits for x and s charts. Is the process still in control? Note: calculate the control limits and central lines for each chart then use Excel to create the charts. Submit both word document showing all the calculations and formulas and Excel sheet
Step by Step Solution
There are 3 Steps involved in it
1 Expert Approved Answer
Step: 1 Unlock

Question Has Been Solved by an Expert!
Get step-by-step solutions from verified subject matter experts
Step: 2 Unlock
Step: 3 Unlock