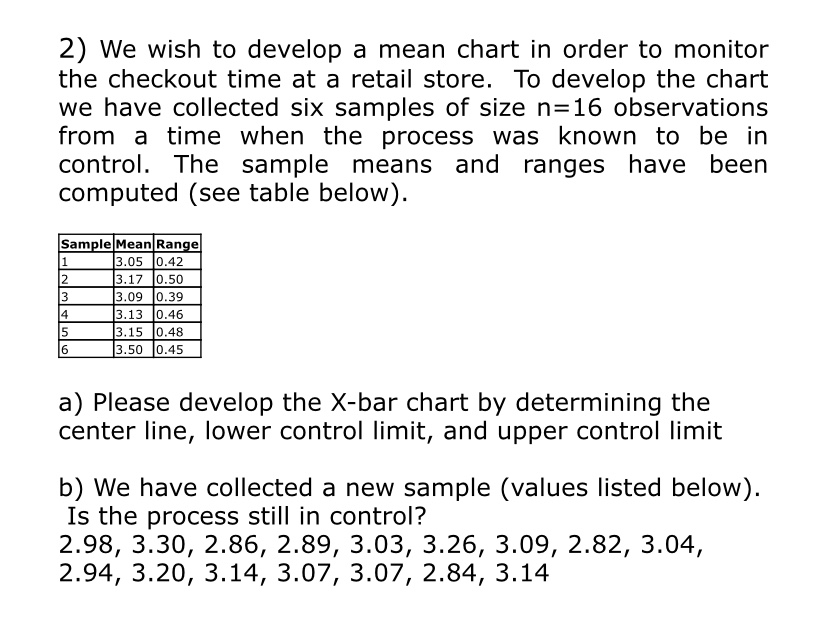
Question: 2) We wish to develop a mean chart in order to monitor the checkout time at a retail store. To develop the chart we have

2) We wish to develop a mean chart in order to

2) We wish to develop a mean chart in order to monitor the checkout time at a retail store. To develop the chart we have collected six samples of size n=16 observations from a time when the process was known to be in control. The sample means and ranges have been computed (see table below). 1 2 Sample Mean Range 3 .05 0.42 3 .17 0.50 13.09 0.39 3.13 0.46 3 .15 10.48 16 13.50 10.45 5 a) Please develop the X-bar chart by determining the center line, lower control limit, and upper control limit b) We have collected a new sample (values listed below). Is the process still in control? 2.98, 3.30, 2.86, 2.89, 3.03, 3.26, 3.09, 2.82, 3.04, 2.94, 3.20, 3.14, 3.07, 3.07, 2.84, 3.14

Step by Step Solution

There are 3 Steps involved in it

1 Expert Approved Answer
Step: 1 Unlock blur-text-image
Question Has Been Solved by an Expert!

Get step-by-step solutions from verified subject matter experts

Step: 2 Unlock
Step: 3 Unlock

Students Have Also Explored These Related General Management Questions!