

Question: 2. You are to do a full Horizontal Analysis (on the Balance Sheet and on the Income Statement) for the years presented using the oldest
2. You are to do a full Horizontal Analysis (on the Balance Sheet and on the Income Statement) for the years presented using the oldest year as your base year and rolling forward that base year to the most recent year. In other words, for the Balance Sheet which contains 2 years of data, you compare the oldest year to the most recent year. Easy. But for the Income Statement, there should be 3 years included in your Horizontal Analysis. I am looking for whole dollars here and throughout your report. NO PENNIES! You may also do percents for the Horizontal Analysis, but that is optional. You must state the whole dollar amount of the differences if you want credit. For the income statement, the oldest year gets compared to the middle year first. Then the middle year becomes the base year and that base year gets compared to the most recent year. Thus, the "rolling base year” concept.
3) You are to do a Vertical Analysis (on both the Balance Sheet and Income Statement) for EACH of the years presented. You must show your result as a % (not a decimal number) and round your % results to exactly 2 decimal places (ex: 2.07% ~ not 2% ~ not 2.0734566%).
For these analyses, you are to present the actual tables of your Vertical and Horizontal Analysis. If you only submit commentary on your results, you lose 20 points. Each of these analyses MUST SHOW statement titles, the name of every single individual account as shown on the original financial statement, the exact balances as shown on the original financial statements, and then the columns for your vertical/horizontal calculations.
NOTE: If your tables for #2 and #3 above spill over onto a second page, you must label the top of that subsequent page with headings of the statement AND headings on columns, just as would be in a published report. If these analyses are not user-friendly, you will not get full credit.
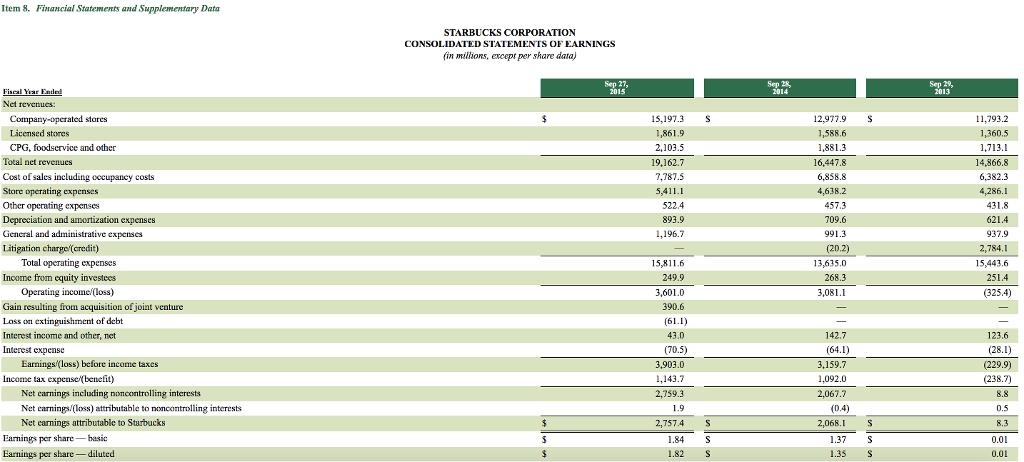
Item 8. Financial Statements and Supplementary Data STARBUCKS CORPORATION CONSOLIDATED STATEMENTS OF EARNINGS (in millions, except per share data) Sep 27, 2015 Sep 28, 2014 Sep 29, 2013 Fiseal Year Entlel Net revenues: Company-operated stores 15,197.3 12,977.9 11,793.2 Licensed stores 1,861.9 1,588.6 1,360.5 CPG, foodservice and other 2,103.5 1,881.3 1,713.1 Total net revenues 19,162.7 16,447.8 14,866.8 Cost of sales including occupancy costs Store operating expenses 7,787.5 6,858.8 6,382.3 5,411.1 4,638.2 4,286.1 Other operating expenses 522.4 457.3 431.8 Depreciation and amortization expenses General and administrative expenses 893.9 709.6 621.4 1,196.7 991.3 937.9 Litigation charge/(credit) Total operating expenses (20.2) 2,784.1 15,811.6 13,635.0 15,443.6 Income from equity investees 249.9 268.3 251.4 Operating income/(loss) 3,601.0 3,081.1 (325.4) Gain resulting from acquisition of joint venture 390.6 Loss on extinguishment of debt (61.1) - Interest income and other, net 43.0 142.7 123.6 Interest expense (70.5) (64.1) (28.1) Earnings/(loss) before income taxes 3,903.0 3,159.7 (229.9) Income tax expense/(benefit) Net earnings including noncontrolling interests 1,143.7 1,092.0 (238.7) 2,759.3 2,067.7 8.8 Net earnings/(los) attributable to noncontrolling interests Net earnings attributable to Sturbucks Earnings per share-basic Earnings per share -diluted 1.9 (0.4) 0.5 2,757.4 2,068.1 8.3 1.84 1.37 0.01 1.82 1.35 0.01
Step by Step Solution
3.50 Rating (153 Votes )
There are 3 Steps involved in it
Statement of Profit and Loss Account Horizontal Analysis Sep 28 Sep 29 IncreaseDecrease Sep 29 Sep 28 IncreaseDecrease 2014 2013 2015 2014 Net revenues Companyoperated stores 1297790 1179320 1185 1519... View full answer

Get step-by-step solutions from verified subject matter experts