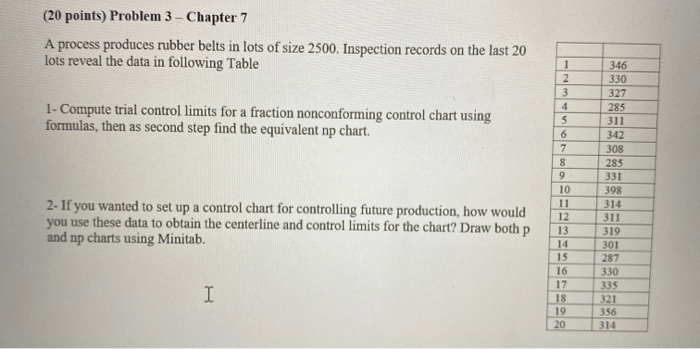
Question: (20 points) Problem 3 - Chapter 7 A process produces rubber belts in lots of size 2500. Inspection records on the last 20 lots reveal

(20 points) Problem 3 - Chapter 7 A process
(20 points) Problem 3 - Chapter 7 A process produces rubber belts in lots of size 2500. Inspection records on the last 20 lots reveal the data in following Table 216 1- Compute trial control limits for a fraction nonconforming control chart using formulas, then as second step find the equivalent np chart. 330 327 285 311 342 308 285 331 398 314 311 319 2- If you wanted to set up a control chart for controlling future production, how would you use these data to obtain the centerline and control limits for the chart? Draw both p and np charts using Minitab. 12 13 301 287 330 335 321 356

Step by Step Solution

There are 3 Steps involved in it

1 Expert Approved Answer
Step: 1 Unlock blur-text-image
Question Has Been Solved by an Expert!

Get step-by-step solutions from verified subject matter experts

Step: 2 Unlock
Step: 3 Unlock

Students Have Also Explored These Related General Management Questions!