

Question: Problem 4 A ( np and p charts ) . A process produces rubber belts in lots of size 2 , 5 0 0 .
Problem np and charts A process produces rubber
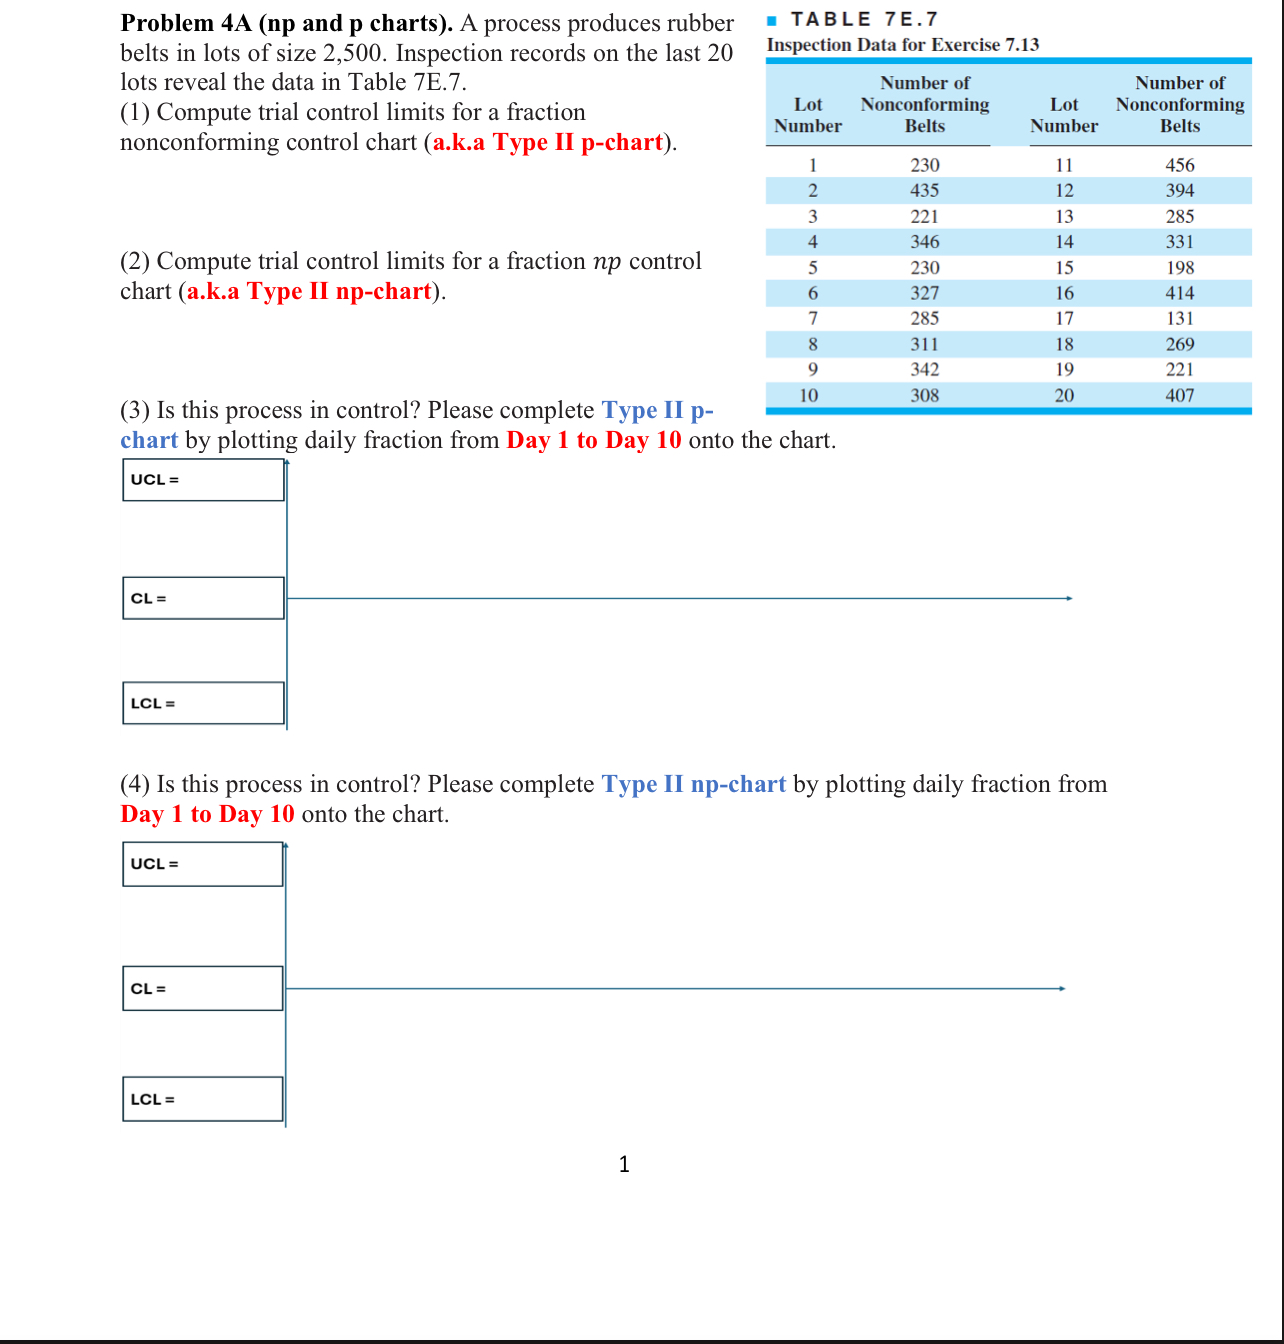
belts in lots of size Inspection records on the last
lots reveal the data in Table E
Compute trial control limits for a fraction
nonconforming control chart aka Type II pchart
Compute trial control limits for a fraction control
chart aka Type II npchart
Is this process in control? Please complete Type II p
TABLE
Inspection Data for Exercise
chart by plotting daily fraction from Day to Day onto the chart.
Is this process in control? Please complete Type II npchart by plotting daily fraction from
Day to Day onto the chart.
Step by Step Solution
There are 3 Steps involved in it
1 Expert Approved Answer
Step: 1 Unlock

Question Has Been Solved by an Expert!
Get step-by-step solutions from verified subject matter experts
Step: 2 Unlock
Step: 3 Unlock