

Question: Problem 2 ( 2 2 points ) . A process produces rubber belts in lots of size 2 , 5 0 0 . Inspection records
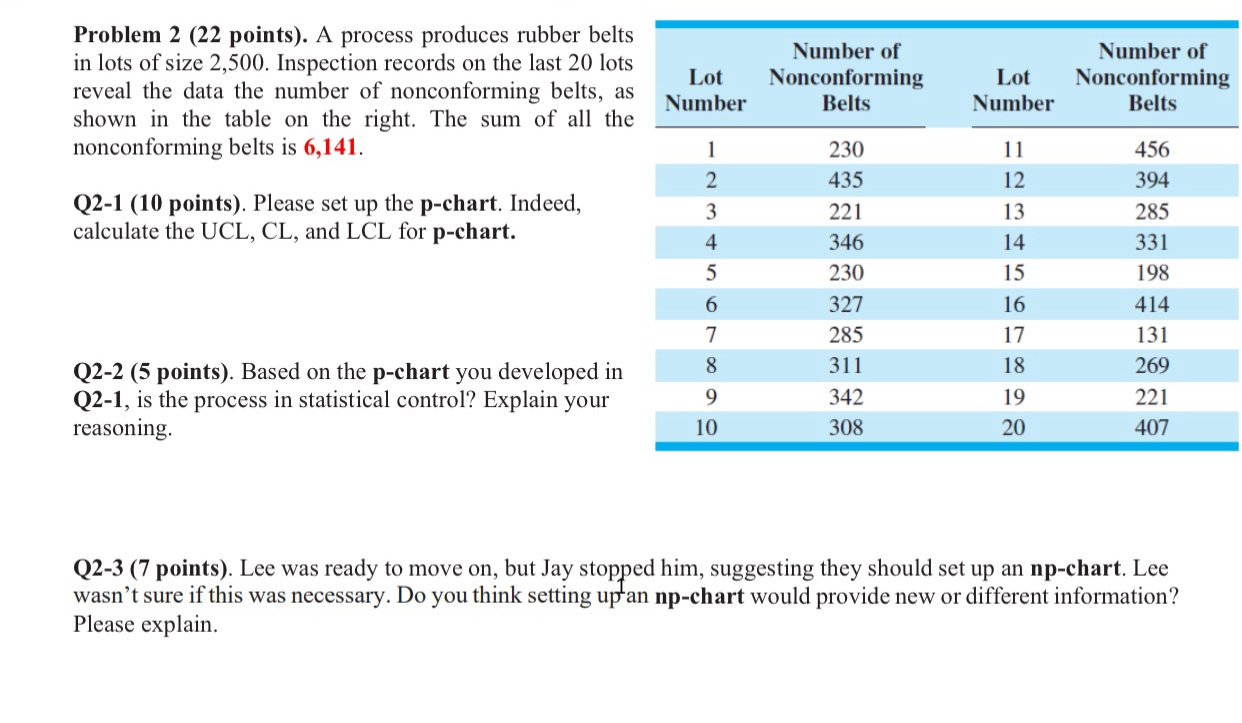
Problem points A process produces rubber belts in lots of size Inspection records on the last lots reveal the data the number of nonconforming belts, as shown in the table on the right. The sum of all the nonconforming belts is
Q points Please set up the pchart. Indeed, calculate the UCL, CL and LCL for chart.
Q points Based on the pchart you developed in Q is the process in statistical control? Explain your reasoning.
tabletableLotNumberNumber of Nonconforming Belts,tableLotNumberNumber of Nonconforming Belts
Q points Lee was ready to move on but Jay stopped him, suggesting they should set up an npchart. Lee wasn't sure if this was necessary. Do you think setting uptan npchart would provide new or different information? Please explain.
Step by Step Solution
There are 3 Steps involved in it
1 Expert Approved Answer
Step: 1 Unlock

Question Has Been Solved by an Expert!
Get step-by-step solutions from verified subject matter experts
Step: 2 Unlock
Step: 3 Unlock