

Question: 2096 $50 $0 Three Two years last year This year years ago ago Total Stockholders' Equity Total Liabilities 096 Three Two years Last year. This
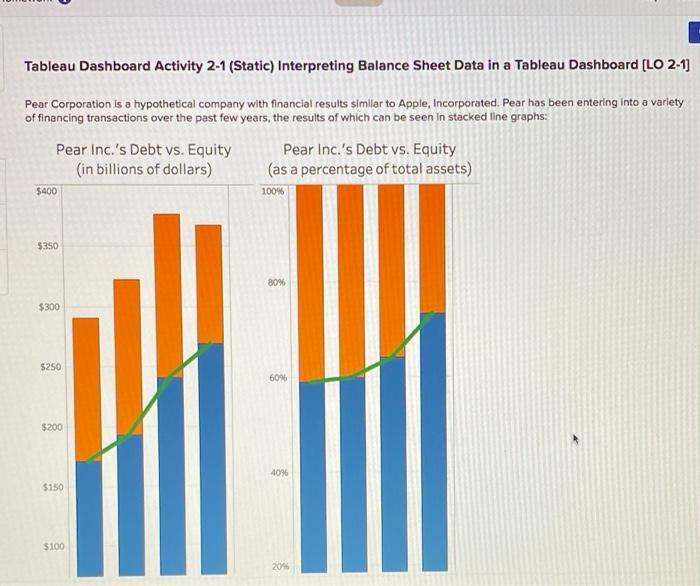
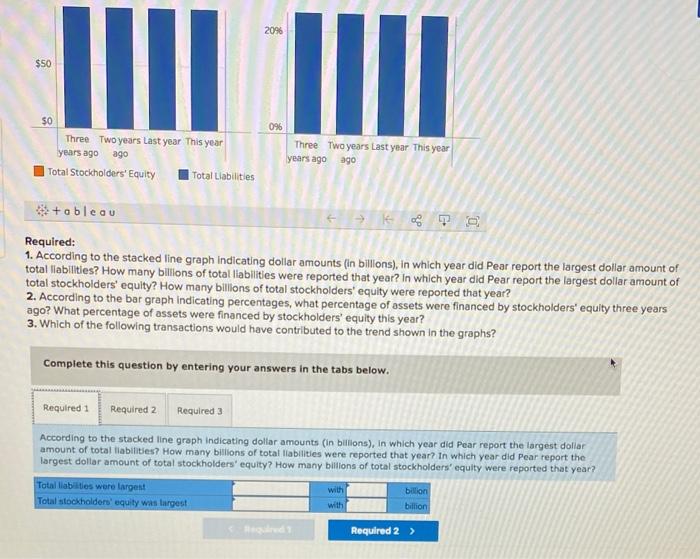
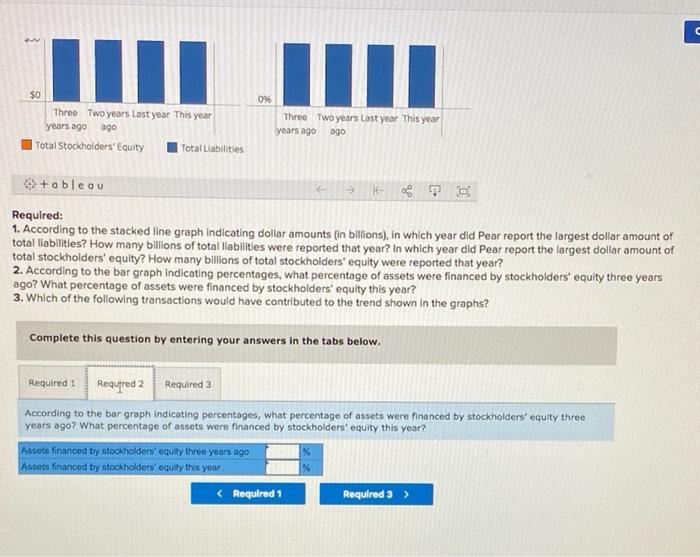
2096 $50 $0 Three Two years last year This year years ago ago Total Stockholders' Equity Total Liabilities 096 Three Two years Last year. This year years ago ago $+ableau Required: 1. According to the stacked line graph indicating dollar amounts (in billions), in which year did Pear report the largest dollar amount of total liabilities? How many billions of total liabilities were reported that year? In which year did Pear report the largest dollar amount of total stockholders' equity? How many billions of total stockholders' equity were reported that year? 2. According to the bar graph indicating percentages, what percentage of assets were financed by stockholders' equity three years ago? What percentage of assets were financed by stockholders' equity this year? 3. Which of the following transactions would have contributed to the trend shown in the graphs? Complete this question by entering your answers in the tabs below. Required 1 Required 2 Required 3 According to the stacked line graph indicating dollar amounts (in billions), in which year did Pear report the largest dollar amount of total liabilities? How many billions of total liabilities were reported that year? In which year did Pear report the largest dollar amount of total stockholders' equity? How many billions of total stockholders' equity were reported that year? Total liabilities were largest with billion Total stockholders' equity was largest with billion Required 2 > C IIIL MINI $0 Three Two years last year. This year ago Total Stockholders' Equity | Total Liabilities years ago Three Two years Last year This year years ago ago +ableau > Boy TO Required: 1. According to the stacked line graph indicating dollar amounts (in billions), in which year did Pear report the largest dollar amount of total liabilities? How many billions of total llabilities were reported that year? In which year did Pear report the largest dollar amount of total stockholders' equity? How many billions of total stockholders' equity were reported that year? 2. According to the bar graph Indicating percentages, what percentage of assets were financed by stockholders' equity three years ago? What percentage of assets were financed by stockholders' equity this year? 3. Which of the following transactions would have contributed to the trend shown in the graphs? Complete this question by entering your answers in the tabs below. Required 1 Requered 2 Required 3 According to the bar graph indicating percentages, what percentage of assets were financed by stockholders' egulty three years ago? What percentage of assets were financed by stockholders' equity this year? Assets financed by stockholders' equity three years ago Antets financed by stockholders equity this your X
Step by Step Solution
There are 3 Steps involved in it

Get step-by-step solutions from verified subject matter experts