

Question: 2.1. Plot the curve for the risks and expected returns of the optimal portfolio combinations in the 4 asset classes in Exhibit 6 Exhibit 6
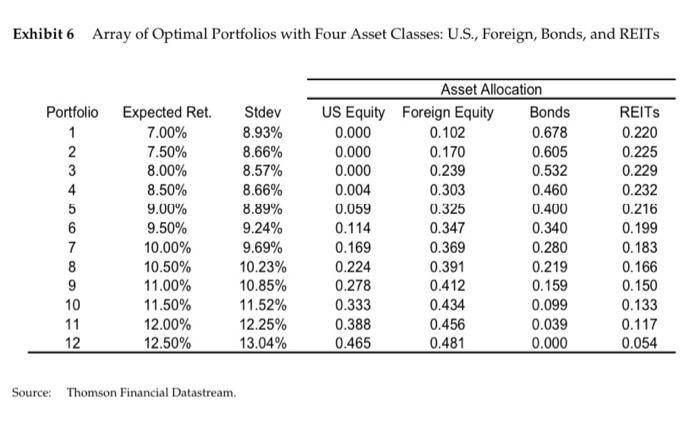
Exhibit 6 Array of Optimal Portfolios with Four Asset Classes: U.S., Foreign, Bonds, and REITS AWN Portfolio Expected Ret. 1 7.00% 2 7.50% 3 8.00% 4 8.50% 5 9.00% 6 9.50% 7 10.00% 8 10.50% 9 11.00% 10 11.50% 11 12.00% 12.50% Stdev 8.93% 8.66% 8.57% 8.66% 8.89% 9.24% 9.69% 10.23% 10.85% 11.52% 12.25% 13.04% Asset Allocation US Equity Foreign Equity Bonds 0.000 0.102 0.678 0.000 0.170 0.605 0.000 0.239 0.532 0.004 0.303 0.460 0.059 0.325 0.400 0.114 0.347 0.340 0.169 0.369 0.280 0.224 0.391 0.219 0.278 0.412 0.159 0.333 0.434 0.099 0.388 0.456 0.039 0.465 0.481 0.000 REITS 0.220 0.225 0.229 0.232 0.216 0.199 0.183 0.166 0.150 0.133 0.117 0.054 12 Source: Thomson Financial Datastream
Step by Step Solution
There are 3 Steps involved in it

Get step-by-step solutions from verified subject matter experts