

Question: On Exhibit 5, plot the curve for the risks and expected returns of the optimal combinations in the 4 asset case detailed in Exhibit 6,
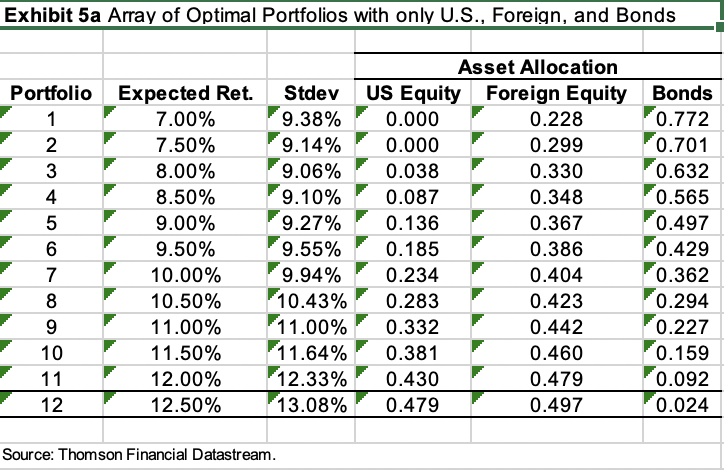
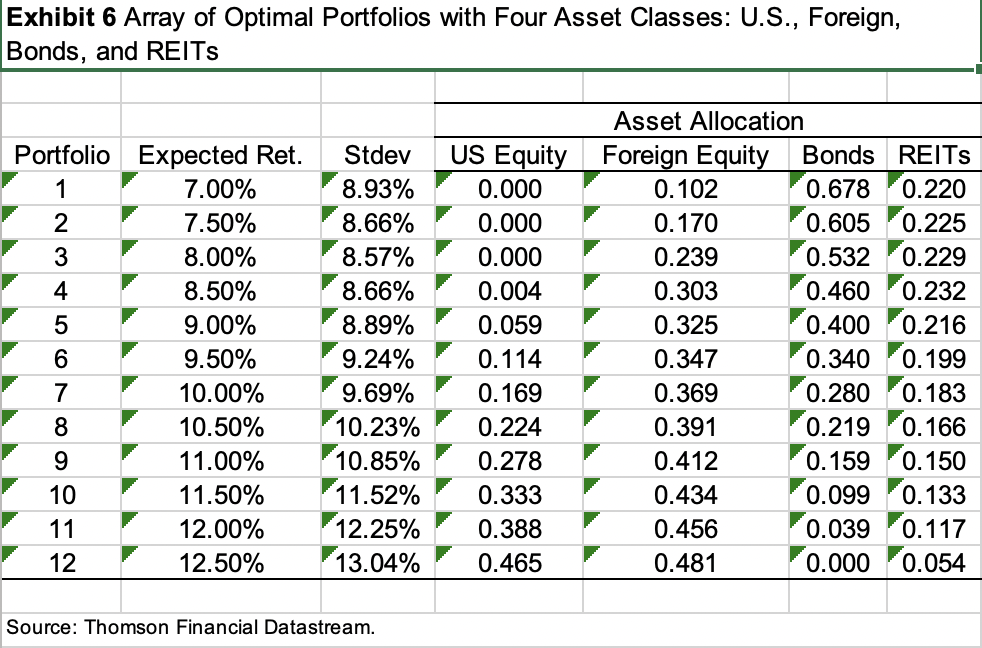
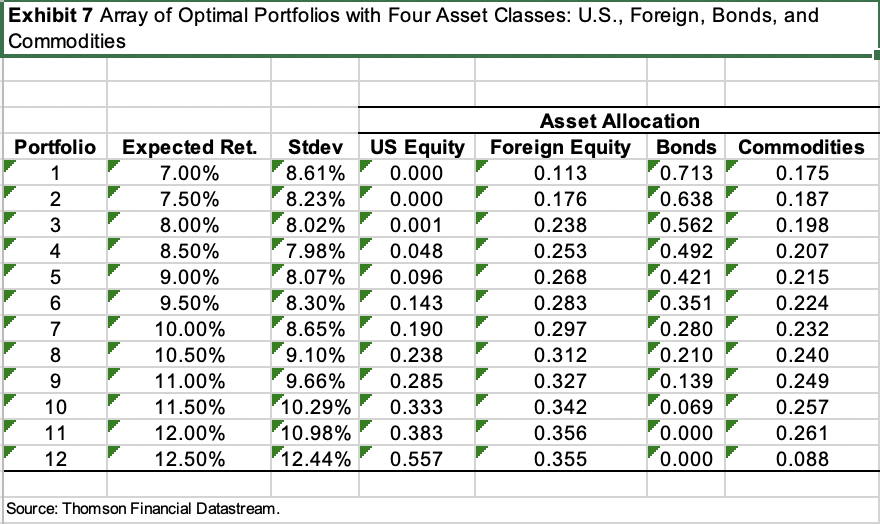
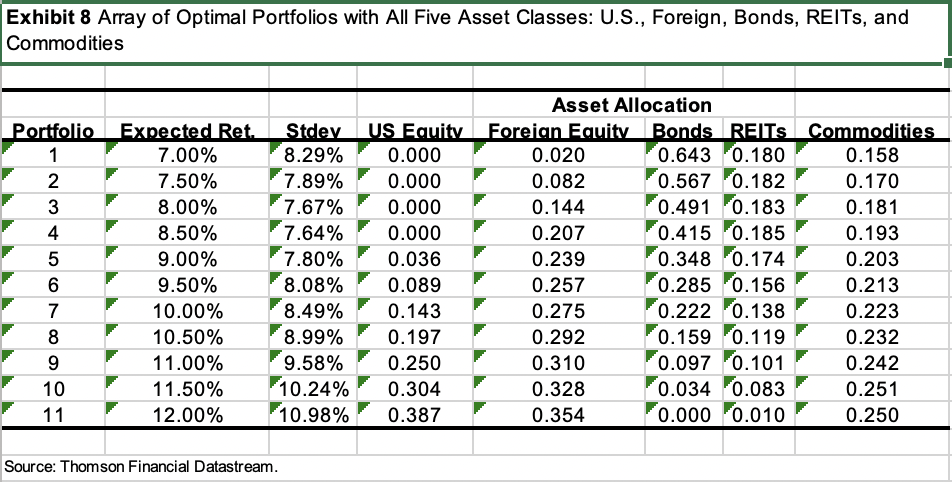 On Exhibit 5, plot the curve for the risks and expected returns of the optimal combinations in the 4 asset case detailed in Exhibit 6, namely: US Equities, Foreign Equities, Bonds, and REITs. Do the same for the 4 asset case shown in Exhibit 7: US, Foreign, Bonds, and commodities. Do the same for the 5 asset class detailed in Exhibit 8: US, Foreign, Bonds, REITs and commodities. How much does each of the real assets improve the potential opportunities for the hospitals investing in the LTP? What are the important factors that determine the degree of improvement?
Exhibit 5a Array of Optimal Portfolios with only U.S., Foreign, and Bonds Portfolio Expected Ret. Stdev 1 7.00% 9.38% 2 7.50% 9.14% 3 8.00% 9.06% 4 8.50% 9.10% 5 9.00% 9.27% 6 9.50% 9.55% 7 10.00% 9.94% 8 10.50% 10.43% 9 11.00% 11.00% 10 11.50% 11.64% 11 12.00% 12.33% 12 12.50% 13.08% Asset Allocation US Equity Foreign Equity Bonds 0.000 0.228 0.772 0.000 0.299 0.701 0.038 0.330 0.632 0.087 0.348 0.565 0.136 0.367 0.497 0.185 0.386 0.429 0.234 0.404 0.362 0.283 0.423 0.294 0.332 0.442 0.227 0.381 0.460 0.159 0.430 0.479 0.092 0.479 0.497 0.024 Source: Thomson Financial Datastream. Exhibit 6 Array of Optimal Portfolios with Four Asset Classes: U.S., Foreign, Bonds, and REITS Portfolio Expected Ret. 1 7.00% 2 7.50% 3 8.00% 4 8.50% 5 9.00% 6 9.50% 7 10.00% 8 10.50% 9 11.00% 10 11.50% 11 12.00% 12 12.50% Stdev 8.93% 8.66% 8.57% 8.66% 8.89% 9.24% 9.69% 10.23% 10.85% 11.52% 12.25% 13.04% Asset Allocation US Equity Foreign Equity Bonds REITS 0.000 0.102 0.678 0.220 0.000 0.170 0.605 0.225 0.000 0.239 0.532 0.229 0.004 0.303 0.460 0.232 0.059 0.325 0.400 0.216 0.114 0.347 0.340 0.199 0.169 0.369 0.280 0.183 0.224 0.391 0.219 0.166 0.278 0.412 0.159 0.150 0.333 0.434 0.099 0.133 0.388 0.456 0.039 0.117 0.465 0.481 0.000 0.054 Source: Thomson Financial Datastream. Exhibit 7 Array of Optimal Portfolios with Four Asset Classes: U.S., Foreign, Bonds, and Commodities Portfolio Expected Ret. 1 7.00% 2 7.50% 3 8.00% 4 8.50% 5 9.00% 6 9.50% 7 10.00% 8 10.50% 9 11.00% 10 11.50% 11 12.00% 12 12.50% Asset Allocation Stdev US Equity Foreign Equity Bonds 8.61% 0.000 0.113 0.713 8.23% 0.000 0.176 0.638 8.02% 0.001 0.238 0.562 7.98% 0.048 0.253 0.492 8.07% 0.096 0.268 0.421 8.30% 0.143 0.283 0.351 8.65% 0.190 0.297 0.280 9.10% 0.238 0.312 0.210 9.66% 0.285 0.327 0.139 10.29% 0.333 0.342 0.069 10.98% 0.383 0.356 0.000 12.44% 0.557 0.355 0.000 Commodities 0.175 0.187 0.198 0.207 0.215 0.224 0.232 0.240 0.249 0.257 0.261 0.088 Source: Thomson Financial Datastream. Exhibit 8 Array of Optimal Portfolios with All Five Asset Classes: U.S., Foreign, Bonds, REITs, and Commodities Portfolio 1 2 3 4 5 6 7 8 9 10 11 Expected Ret. Stdey 7.00% 8.29% 7.50% 7.89% 8.00% 7.67% 8.50% 7.64% 9.00% 7.80% 9.50% 8.08% 10.00% 8.49% 10.50% 8.99% 11.00% 9.58% 11.50% 10.24% 12.00% 10.98% Asset Allocation US Equity Foreign Equity Bonds REITs Commodities 0.000 0.020 0.643 0.180 0.158 0.000 0.082 0.567 0.182 0.170 0.000 0.144 0.491 0.183 0.181 0.000 0.207 0.415 0.185 0.193 0.036 0.239 0.348 0.174 0.203 0.089 0.257 0.285 0.156 0.213 0.143 0.275 0.222 0.138 0.223 0.197 0.292 0.159 0.119 0.232 0.250 0.310 0.097 0.101 0.242 0.304 0.328 0.034 0.083 0.251 0.387 0.354 0.000 0.010 0.250 Source: Thomson Financial Datastream. Exhibit 5a Array of Optimal Portfolios with only U.S., Foreign, and Bonds Portfolio Expected Ret. Stdev 1 7.00% 9.38% 2 7.50% 9.14% 3 8.00% 9.06% 4 8.50% 9.10% 5 9.00% 9.27% 6 9.50% 9.55% 7 10.00% 9.94% 8 10.50% 10.43% 9 11.00% 11.00% 10 11.50% 11.64% 11 12.00% 12.33% 12 12.50% 13.08% Asset Allocation US Equity Foreign Equity Bonds 0.000 0.228 0.772 0.000 0.299 0.701 0.038 0.330 0.632 0.087 0.348 0.565 0.136 0.367 0.497 0.185 0.386 0.429 0.234 0.404 0.362 0.283 0.423 0.294 0.332 0.442 0.227 0.381 0.460 0.159 0.430 0.479 0.092 0.479 0.497 0.024 Source: Thomson Financial Datastream. Exhibit 6 Array of Optimal Portfolios with Four Asset Classes: U.S., Foreign, Bonds, and REITS Portfolio Expected Ret. 1 7.00% 2 7.50% 3 8.00% 4 8.50% 5 9.00% 6 9.50% 7 10.00% 8 10.50% 9 11.00% 10 11.50% 11 12.00% 12 12.50% Stdev 8.93% 8.66% 8.57% 8.66% 8.89% 9.24% 9.69% 10.23% 10.85% 11.52% 12.25% 13.04% Asset Allocation US Equity Foreign Equity Bonds REITS 0.000 0.102 0.678 0.220 0.000 0.170 0.605 0.225 0.000 0.239 0.532 0.229 0.004 0.303 0.460 0.232 0.059 0.325 0.400 0.216 0.114 0.347 0.340 0.199 0.169 0.369 0.280 0.183 0.224 0.391 0.219 0.166 0.278 0.412 0.159 0.150 0.333 0.434 0.099 0.133 0.388 0.456 0.039 0.117 0.465 0.481 0.000 0.054 Source: Thomson Financial Datastream. Exhibit 7 Array of Optimal Portfolios with Four Asset Classes: U.S., Foreign, Bonds, and Commodities Portfolio Expected Ret. 1 7.00% 2 7.50% 3 8.00% 4 8.50% 5 9.00% 6 9.50% 7 10.00% 8 10.50% 9 11.00% 10 11.50% 11 12.00% 12 12.50% Asset Allocation Stdev US Equity Foreign Equity Bonds 8.61% 0.000 0.113 0.713 8.23% 0.000 0.176 0.638 8.02% 0.001 0.238 0.562 7.98% 0.048 0.253 0.492 8.07% 0.096 0.268 0.421 8.30% 0.143 0.283 0.351 8.65% 0.190 0.297 0.280 9.10% 0.238 0.312 0.210 9.66% 0.285 0.327 0.139 10.29% 0.333 0.342 0.069 10.98% 0.383 0.356 0.000 12.44% 0.557 0.355 0.000 Commodities 0.175 0.187 0.198 0.207 0.215 0.224 0.232 0.240 0.249 0.257 0.261 0.088 Source: Thomson Financial Datastream. Exhibit 8 Array of Optimal Portfolios with All Five Asset Classes: U.S., Foreign, Bonds, REITs, and Commodities Portfolio 1 2 3 4 5 6 7 8 9 10 11 Expected Ret. Stdey 7.00% 8.29% 7.50% 7.89% 8.00% 7.67% 8.50% 7.64% 9.00% 7.80% 9.50% 8.08% 10.00% 8.49% 10.50% 8.99% 11.00% 9.58% 11.50% 10.24% 12.00% 10.98% Asset Allocation US Equity Foreign Equity Bonds REITs Commodities 0.000 0.020 0.643 0.180 0.158 0.000 0.082 0.567 0.182 0.170 0.000 0.144 0.491 0.183 0.181 0.000 0.207 0.415 0.185 0.193 0.036 0.239 0.348 0.174 0.203 0.089 0.257 0.285 0.156 0.213 0.143 0.275 0.222 0.138 0.223 0.197 0.292 0.159 0.119 0.232 0.250 0.310 0.097 0.101 0.242 0.304 0.328 0.034 0.083 0.251 0.387 0.354 0.000 0.010 0.250 Source: Thomson Financial Datastream
Step by Step Solution
There are 3 Steps involved in it

Get step-by-step solutions from verified subject matter experts