

Question: plot the curve for the risks and expected returns of the optimal portfolio combinations in tne 5 asset classes. (given below in second photo) 2.
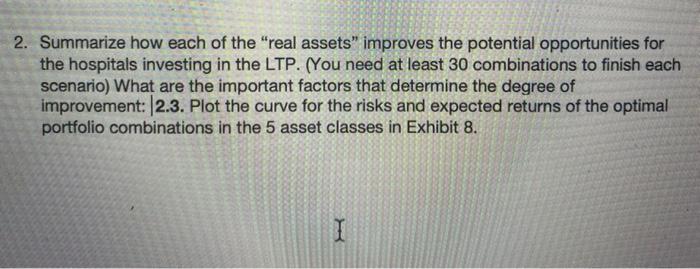
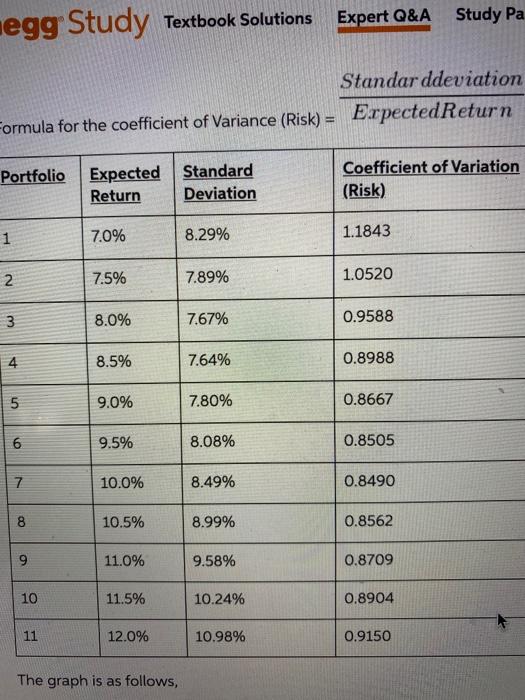
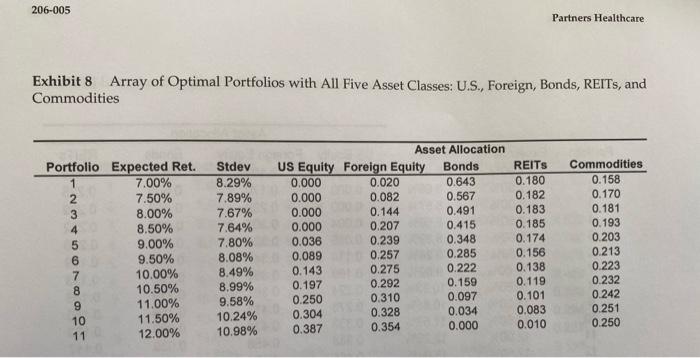
2. Summarize how each of the "real assets" improves the potential opportunities for the hospitals investing in the LTP. (You need at least 30 combinations to finish each scenario) What are the important factors that determine the degree of improvement: 2.3. Plot the curve for the risks and expected returns of the optimal portfolio combinations in the 5 asset classes in Exhibit 8. I negg Study Textbook Solutions Expert Q&A Study Pa Standar ddeviation Formula for the coefficient of Variance (Risk) = Erpected Return Portfolio Expected Standard Return Deviation Coefficient of Variation (Risk) 1 7.0% 8.29% 1.1843 N 7.5% 7.89% 1.0520 3 3 8.0% 7.67% 0.9588 4 8.5% 7.64% 0.8988 9.0% 7.80% 0.8667 6 6 9.5% 8.08% 0.8505 7 10.0% 8.49% 0.8490 8 10.5% 8.99% 0.8562 9 11.0% 9.58% 0.8709 10 11.5% 10.24% 0.8904 11 12.0% 10.98% 0.9150 The graph is as follows, 206-005 Partners Healthcare Exhibit 8 Array of Optimal Portfolios with All Five Asset Classes: U.S., Foreign, Bonds, REITs, and Commodities Portfolio Expected Ret. 7.00% 2 7.50% 3 8.00% 4 8.50% 5 9.00% 6 9.50% 10.00% 8 10.50% 9 11.00% 10 11.50% 11 12.00% Stdev 8.29% 7.89% 7.67% 7.64% 7.80% 8.08% 8.49% 8.99% 9.58% 10.24% 10.98% Asset Allocation US Equity Foreign Equity Bonds 0.000 0.020 0.643 0.000 0.082 0.567 0.000 0.144 0.491 0.000 0.207 0.415 0.036 0.239 0.348 0.089 0.257 0.285 0.143 0.275 0.222 0.197 0.292 0.159 0.250 0.310 0.097 0.304 0.328 0.034 0.387 0.354 0.000 REITS 0.180 0.182 0.183 0.185 0.174 0.156 0.138 0.119 0.101 0.083 0.010 Commodities 0.158 0.170 0.181 0.193 0.203 0.213 0.223 0.232 0.242 0.251 0.250 2. Summarize how each of the "real assets" improves the potential opportunities for the hospitals investing in the LTP. (You need at least 30 combinations to finish each scenario) What are the important factors that determine the degree of improvement: 2.3. Plot the curve for the risks and expected returns of the optimal portfolio combinations in the 5 asset classes in Exhibit 8. I negg Study Textbook Solutions Expert Q&A Study Pa Standar ddeviation Formula for the coefficient of Variance (Risk) = Erpected Return Portfolio Expected Standard Return Deviation Coefficient of Variation (Risk) 1 7.0% 8.29% 1.1843 N 7.5% 7.89% 1.0520 3 3 8.0% 7.67% 0.9588 4 8.5% 7.64% 0.8988 9.0% 7.80% 0.8667 6 6 9.5% 8.08% 0.8505 7 10.0% 8.49% 0.8490 8 10.5% 8.99% 0.8562 9 11.0% 9.58% 0.8709 10 11.5% 10.24% 0.8904 11 12.0% 10.98% 0.9150 The graph is as follows, 206-005 Partners Healthcare Exhibit 8 Array of Optimal Portfolios with All Five Asset Classes: U.S., Foreign, Bonds, REITs, and Commodities Portfolio Expected Ret. 7.00% 2 7.50% 3 8.00% 4 8.50% 5 9.00% 6 9.50% 10.00% 8 10.50% 9 11.00% 10 11.50% 11 12.00% Stdev 8.29% 7.89% 7.67% 7.64% 7.80% 8.08% 8.49% 8.99% 9.58% 10.24% 10.98% Asset Allocation US Equity Foreign Equity Bonds 0.000 0.020 0.643 0.000 0.082 0.567 0.000 0.144 0.491 0.000 0.207 0.415 0.036 0.239 0.348 0.089 0.257 0.285 0.143 0.275 0.222 0.197 0.292 0.159 0.250 0.310 0.097 0.304 0.328 0.034 0.387 0.354 0.000 REITS 0.180 0.182 0.183 0.185 0.174 0.156 0.138 0.119 0.101 0.083 0.010 Commodities 0.158 0.170 0.181 0.193 0.203 0.213 0.223 0.232 0.242 0.251 0.250
Step by Step Solution
There are 3 Steps involved in it

Get step-by-step solutions from verified subject matter experts