

Question: 21. What is this year's forecast using a three-year simple moving average? A. 2,600 B. 2,667 C. 2,500 D. 2,400 E. 2,333 22. What is
21. What is this year's forecast using a three-year simple moving average?
A. 2,600
B. 2,667
C. 2,500
D. 2,400
E. 2,333
22. What is this year's forecast using a three-year weighted moving average with weights of 0.5, 0.3, and 0.2?
A. 2,220
B. 2,540
C. 2,667
D. 3,000
E. 2,780
23. What is this year's forecast using exponential smoothing with alpha = 0.4, if year 2018's smoothed forecast was 2,600?
A. 2,680
B. 2,760
C. 2,808
D. 3,128
E. 3,160
24. What is the slope (b) of the least squares trend line for these data?
A. 360
B. 200
C. 400
D. 180
E. 90
25. What is the Y-intercept (a) of the least squares trend line for these data?
A. 1,500
B. 1,600
C. 2,000
D. 2,050
E. 2,275
26. What is this year's forecast using the least squares trend line for these data?
A. 2,725
B. 2,950
C. 3,000
D. 3,400
E. 3,500
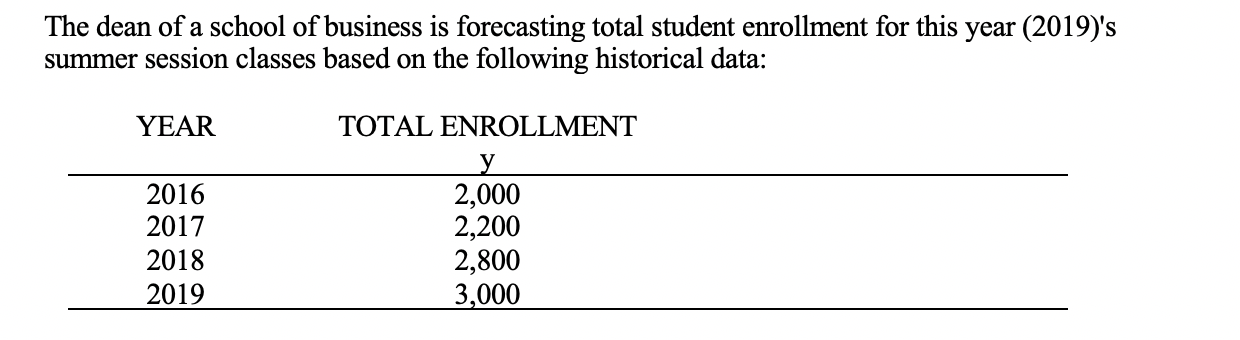
The dean of a school of business is forecasting total student enrollment for this year (2019)'s summer session classes based on the following historical data: YEAR 2016 2017 2018 2019 TOTAL ENROLLMENT 2,000 2,200 2,800 3,000Step by Step Solution
There are 3 Steps involved in it

Get step-by-step solutions from verified subject matter experts