

Question: 2.17 LAB: Line charts Write a program that subsets the loads and subsets the stock market data in target.CSV. Load the the data from target.csv
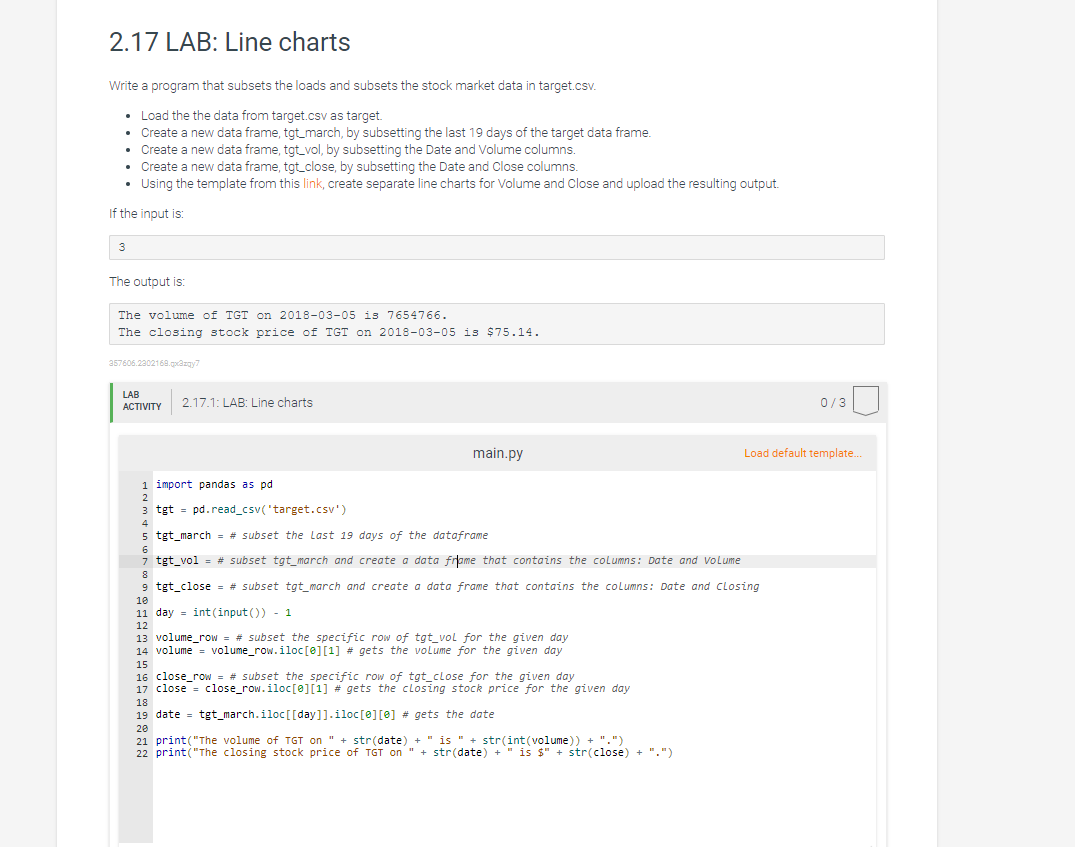
2.17 LAB: Line charts Write a program that subsets the loads and subsets the stock market data in target.CSV. Load the the data from target.csv as target. . Create a new data frame, tot_march, by subsetting the last 19 days of the target data frame. . Create a new data frame, tot_vol, by subsetting the Date and Volume columns. Create a new data frame, tot_close, by subsetting the Date and Close columns. Using the template from this link, create separate line charts for Volume and Close and upload the resulting output. If the input is: 3 The output is: The volume of TGT on 2018-03-05 is 7654766. The closing stock price of IGT on 2018-03-05 is $75.14. 357606.23021 68.upcazgy7 LAB ACTIVITY 2.17.1: LAB: Line charts 0 / 3 main.py Load default template... import pandas as pd tgt = pd. read_cav( 'target.csv' ) tgt_march = # subset the Last 19 days of the dataframe tgt_vol = # subset tgt_march and create a data frame that contains the columns: Date and Volume tgt_close = # subset tgt_march and create a data frame that contains the columns: Date and Closing 11 day = int (input() ) - 1 12 13 volume_row = # subset the specific row of tgt_vol for the given day 14 volume = volume_row. iloc[@][1] # gets the volume for the given day 15 16 close_row = # subset the specific row of tgt_close for the given day 17 close = close_row. iloc[@][1] # gets the closing stock price for the given day 18 19 date = tgt_march. iloc [[day]]. iloc [0] # gets the date 20 21 print("The volume of TGT on " + str(date) + str(int(volume)) + ".") 22 print("The closing stock price of TGT on " + str(date) + " is $" + str(close) + ".")
Step by Step Solution
There are 3 Steps involved in it

Get step-by-step solutions from verified subject matter experts