

Question: Values of drawdown and time in a pumping test are listed in the table below. Determine the transmissivity and storativity of a confined aquifer
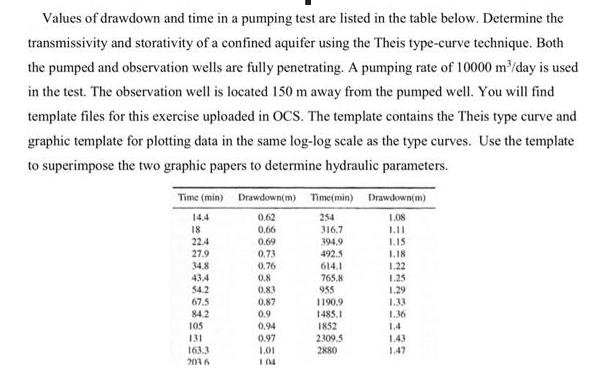
Values of drawdown and time in a pumping test are listed in the table below. Determine the transmissivity and storativity of a confined aquifer using the Theis type-curve technique. Both the pumped and observation wells are fully penetrating. A pumping rate of 10000 m/day is used in the test. The observation well is located 150 m away from the pumped well. You will find template files for this exercise uploaded in OCS. The template contains the Theis type curve and graphic template for plotting data in the same log-log scale as the type curves. Use the template to superimpose the two graphic papers to determine hydraulic parameters. Time (min) Drawdown(m) Time(min) Drawdown(m) 0.62 254 1.08 0,66 316,7 1.11 0.69 394,9 1.15 0.73 492.5 1.18 0.76 614.1 1.22 0.8 765.8 1.25 0.83 955 1.29 0.87 1190.9 0.9 0.94 0.97 1.01 1.04 18 22.4 27.9 34.8 43.4 54.2 67.5 84.2 105 131 163.3 203.6 1485,1 1852 2309.5 2880 1.36 1.4 1.43 1.47
Step by Step Solution
3.44 Rating (147 Votes )
There are 3 Steps involved in it
To determine the transmissivity T and storativity S of a confined aquifer using the Theis typecurve technique we need to superimpose the data points f... View full answer

Get step-by-step solutions from verified subject matter experts