

Question: 2250 FOR ANNUAL DEMAND UNITS Instructions c. Chart for part c There are four parts to this problem. Use Excel to perform the following. a.
2250 FOR ANNUAL DEMAND UNITS
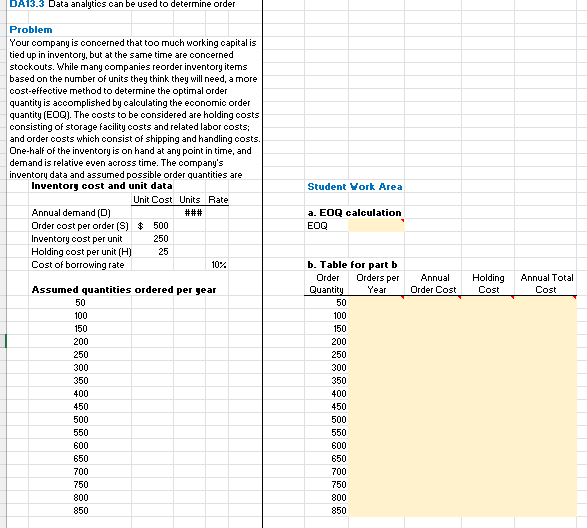
Instructions c. Chart for part c There are four parts to this problem. Use Excel to perform the following. a. Use the economic order quantity formula (EOQ = SQRT((2SD/H)) to determine the optimal number of units that the company should order based on each assumed level of order quantities provided in the data. b. Complete the table by calculating the number of orders per year, annual order cost, annual holding cost, and annual total cost. Highlight the minimum annual total cost using conditional formatting. Hint: The minimum cost should equal the cost at the EOQ you calculated in part a. c. Create a line chart that graphs annual order cost, annual holding cost, and annual total cost. The x-axis should be the quantity ordered. Include a chart legend, appropriate chart title, axes labels, and properly formatted amounts on the axes. d. Examine the chart and your responses to parts a and b. Indicate any relationships. DA13.3 Data analytics oan be used to determine order Problem Your company is concerned that too much working capital is tied up in inwentory, but at the same time are concerned stockouts. While many companies reorder inventory items based on the number of units they think they will need, a more cost-effective method to determine the optimal order quantity is accomplished by calculating the economic order quantity (EDQ). The costs to be considered are holding costs consisting of storage facility costs and related labor costs; and order costs which consist of shipping and handling costs. One-half of the inventory is on hand at any point in time, and demand is relative even across time. The company's inventory data and assumed possible order quantities are Instructions c. Chart for part c There are four parts to this problem. Use Excel to perform the following. a. Use the economic order quantity formula (EOQ = SQRT((2SD/H)) to determine the optimal number of units that the company should order based on each assumed level of order quantities provided in the data. b. Complete the table by calculating the number of orders per year, annual order cost, annual holding cost, and annual total cost. Highlight the minimum annual total cost using conditional formatting. Hint: The minimum cost should equal the cost at the EOQ you calculated in part a. c. Create a line chart that graphs annual order cost, annual holding cost, and annual total cost. The x-axis should be the quantity ordered. Include a chart legend, appropriate chart title, axes labels, and properly formatted amounts on the axes. d. Examine the chart and your responses to parts a and b. Indicate any relationships. DA13.3 Data analytics oan be used to determine order Problem Your company is concerned that too much working capital is tied up in inwentory, but at the same time are concerned stockouts. While many companies reorder inventory items based on the number of units they think they will need, a more cost-effective method to determine the optimal order quantity is accomplished by calculating the economic order quantity (EDQ). The costs to be considered are holding costs consisting of storage facility costs and related labor costs; and order costs which consist of shipping and handling costs. One-half of the inventory is on hand at any point in time, and demand is relative even across time. The company's inventory data and assumed possible order quantities are
Step by Step Solution
There are 3 Steps involved in it

Get step-by-step solutions from verified subject matter experts