

Question: See Table 2.5 E showing financial statement data and stock price data for Mydeco Corp. Suppose Mydeco's costs and expenses had been the same fraction
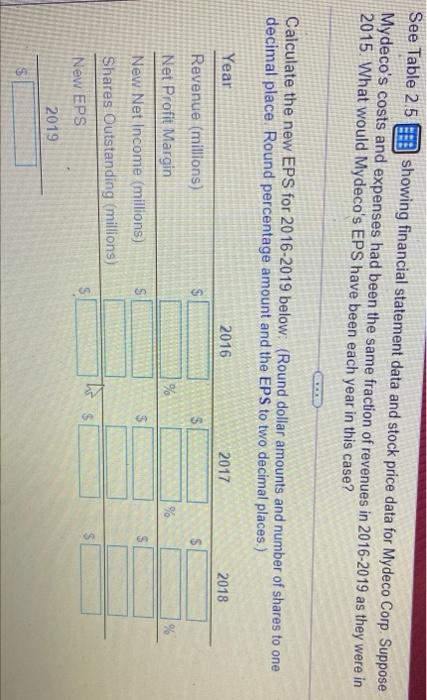
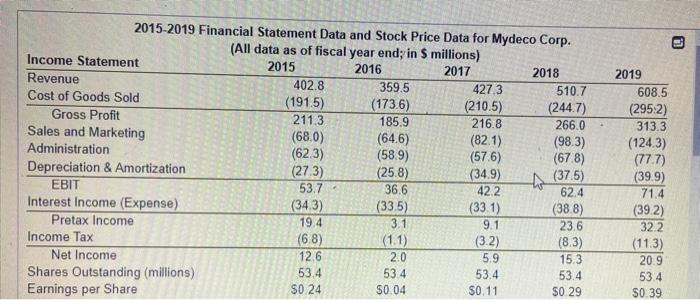
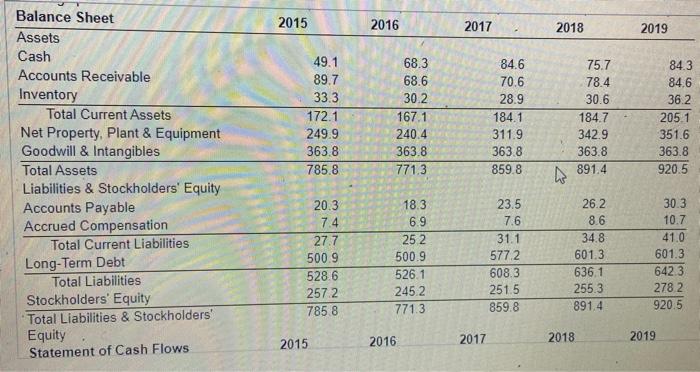
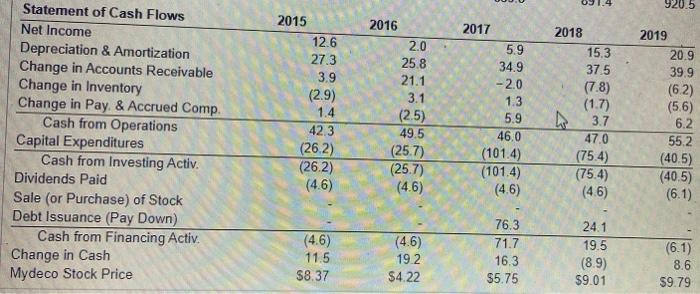
See Table 2.5 E showing financial statement data and stock price data for Mydeco Corp. Suppose Mydeco's costs and expenses had been the same fraction of revenues in 2016-2019 as they were in 2015. What would Mydeco's EPS have been each year in this case? Calculate the new EPS for 2016-2019 below: (Round dollar amounts and number of shares to one decimal place Round percentage amount and the EPS to two decimal places.) Year 2016 2017 2018 $ S % % 96 S $ Revenue (millions) Net Profit Margin New Net Income (millions) Shares Outstanding (millions) New EPS 2019 S hos $ 2015-2019 Financial Statement Data and Stock Price Data for Mydeco Corp. (All data as of fiscal year end; in 5 millions) Income Statement 2015 2016 2017 2018 Revenue 402.8 359.5 4273 510.7 Cost of Goods Sold (191.5) (1736) (210.5) (244.7) Gross Profit 211.3 185.9 216.8 266.0 Sales and Marketing (680) (64.6) (82.1) (98.3) Administration (62.3) (58.9) (57.6) (678) Depreciation & Amortization (273) (25.8) (34.9) to (37.5) EBIT 53.7 36.6 42.2 62.4 Interest Income (Expense) (343) (33.5) (33.1) (388) Pretax Income 19.4 3.1 9.1 23.6 Income Tax (68) (1.1) (3.2) (8.3) Net Income 12.6 2.0 5.9 15.3 Shares Outstanding (millions) 53.4 53.4 53.4 53.4 Earnings per Share SO 24 $0.04 $0.11 $0.29 2019 608.5 (295:2) 313.3 (124.3) (77.7) (39.9) 71.4 (392) 322 (11.3) 20.9 53.4 S0.39 2015 2016 2017 2018 2019 49.1 89.7 33.3 172.1 249.9 363.8 785.8 68.3 68.6 30.2 167.1 240.4 363.8 771.3 84.6 70.6 28.9 184.1 311.9 363.8 859.8 75.7 78.4 30.6 184.7 342.9 363.8 891.4 84.3 84.6 36.2 205.1 351.6 363.8 920.5 Balance Sheet Assets Cash Accounts Receivable Inventory Total Current Assets Net Property, Plant & Equipment Goodwill & Intangibles Total Assets Liabilities & Stockholders' Equity Accounts Payable Accrued Compensation Total Current Liabilities Long-Term Debt Total Liabilities Stockholders' Equity Total Liabilities & Stockholders' Equity Statement of Cash Flows anco 20.3 7.4 27.7 500.9 528.6 257.2 785 8 18.3 6.9 25 2 500.9 526.1 2452 771.3 23.5 7.6 31.1 5772 608.3 251.5 859.8 26.2. 8.6 34.8 601.3 636.1 255.3 891.4 30.3 10.7 41.0 601.3 642.3 2782 920.5 2016 2015 2017 2018 2019 920.5 2017 Statement of Cash Flows Net Income Depreciation & Amortization Change in Accounts Receivable Change in Inventory Change in Pay & Accrued Comp. Cash from Operations Capital Expenditures Cash from Investing Activ. Dividends Paid Sale (or Purchase) of Stock Debt Issuance (Pay Down) Cash from Financing Activ. Change in Cash Mydeco Stock Price 2015 12.6 27.3 3.9 (2.9) 1.4 42.3 (26.2) (26.2) (4.6) 2016 2.0 25.8 21.1 3.1 (2.5) 49.5 (257) (257) (4.6) 5.9 34.9 -2.0 1.3 5.9 46.0 (101.4) (101.4) (4.6) 2018 15.3 37.5 (7.8) (1.7) 3.7 47.0 (75.4) (75.4) (4.6) 2019 20.9 39.9 (62) (56) 6.2 55.2 (40.5) (40.5) (6.1) (4.6) 11.5 $8.37 (4.6) 19.2 $4.22 76.3 71.7 16.3 $5.75 24.1 19.5 (8.9) $9.01 (6.1) 8.6 $9.79
Step by Step Solution
There are 3 Steps involved in it

Get step-by-step solutions from verified subject matter experts