

Question: 2a. From the equilibrium adsorption data, plot the adsorption isotherm models- Langmuir and Freundlich using their empirical linear expressions (20 marks). 2b. From your analysis
2a. From the equilibrium adsorption data, plot the adsorption isotherm models- Langmuir and Freundlich using their empirical linear expressions (20 marks).
2b. From your analysis determine the isotherm model which best describes the equilibrium adsorption data (7 marks)
2c. From the best model identified in question 2b. above, describe the possible mechanism of adsorption according to the model prediction (15 marks).
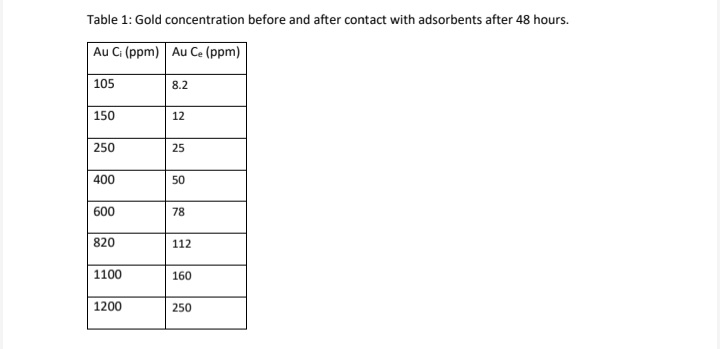
Table 1: Gold concentration before and after contact with adsorbents after 48 hours
Step by Step Solution
There are 3 Steps involved in it
1 Expert Approved Answer
Step: 1 Unlock

Question Has Been Solved by an Expert!
Get step-by-step solutions from verified subject matter experts
Step: 2 Unlock
Step: 3 Unlock