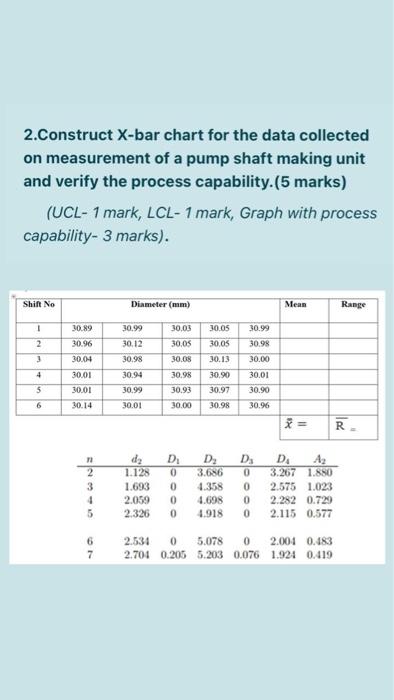
Question: 2.Construct X-bar chart for the data collected on measurement of a pump shaft making unit and verify the process capability (5 marks) (UCL-1 mark, LCL-1

2.Construct X-bar chart for the data collected on
2.Construct X-bar chart for the data collected on measurement of a pump shaft making unit and verify the process capability (5 marks) (UCL-1 mark, LCL-1 mark, Graph with process capability- 3 marks). Shift No Diameter (mm) Mean Range ! 30.99 30.03 30.05 30.99 30.89 30.96 30.04 30.05 30.05 2 3 30.98 30.12 30.98 30.08 30.13 30.00 4 30.01 30.94 30.90 30.01 5 30.01 30.98 30.93 30.00 30.99 30.01 30.97 30.90 30.96 6 30.14 30.98 R 2 3 4 dz 1.128 1.693 2.059 2.326 D 0 0 0 0 D2 3.686 4.358 4.698 4.918 D 0 0 0 0 D. 3.267 1.850 2.575 1.023 2.282 0.729 2.115 0.577 6 7 0 5.078 0 2.004 0.483 2.704 0.2055.203 0.076 1.924 0.419

Step by Step Solution

There are 3 Steps involved in it

1 Expert Approved Answer
Step: 1 Unlock blur-text-image
Question Has Been Solved by an Expert!

Get step-by-step solutions from verified subject matter experts

Step: 2 Unlock
Step: 3 Unlock

Students Have Also Explored These Related General Management Questions!