

Question: fast pls 2.Construct X-bar chart for the data collected on measurement of a pump shaft making unit and verify the process capability. (5 marks) (UCL-
fast pls
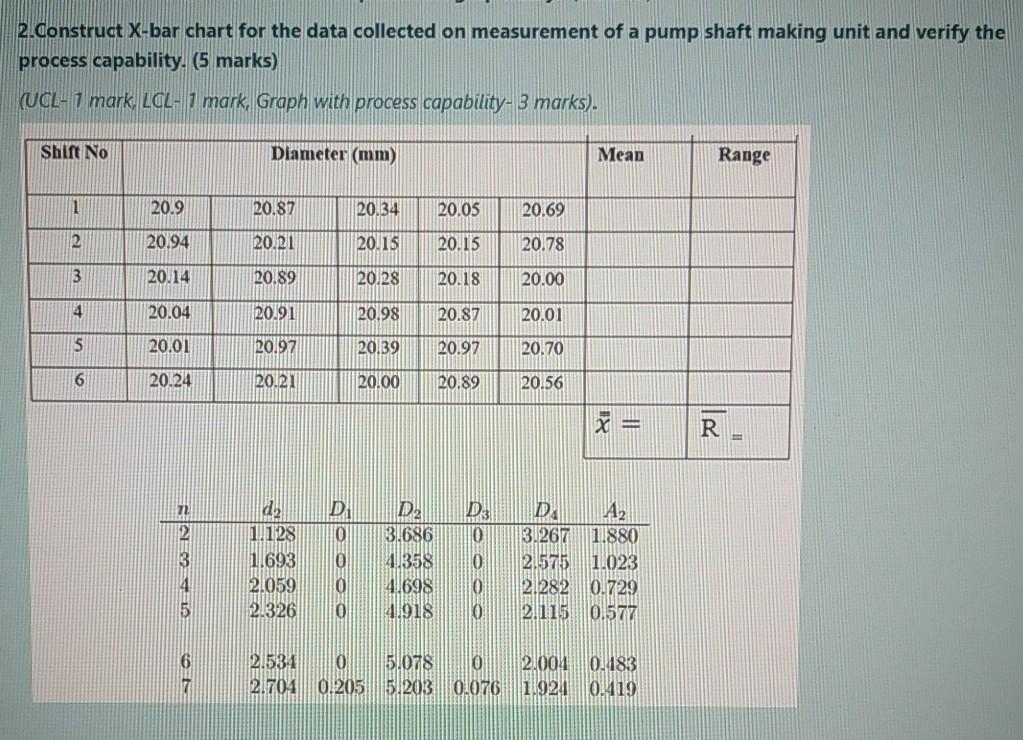
2.Construct X-bar chart for the data collected on measurement of a pump shaft making unit and verify the process capability. (5 marks) (UCL- 1 mark, LCL-1 mark, Graph with process capability. 3 marks). Shift No Diameter (mm) Mean Range 1 20.9 20.87 20.34 20.05 20.69 2 20.94 20.21 20.15 20.15 20.78 3 20.14 20.89 20.28 20.18 20.00 4 20.04 20.91 20.98 20.87 20.01 5 20.01 20.97 20139 20.97 20.70 6 20.24 20.21 20.00 20.89 20.56 lle D 1.128 11693 2.059 21326 Oo oo D2 3.686 4.358 4.698 41918 D3 10 10 0 10 D 142 3.267 11880 21575 11023 21282 0.729 2.115 0.577 4 5 21531 0 15.078 21704 | 0.205||||5.203 OLO76 2.0040.483 1.920. 119Step by Step Solution
There are 3 Steps involved in it
1 Expert Approved Answer
Step: 1 Unlock

Question Has Been Solved by an Expert!
Get step-by-step solutions from verified subject matter experts
Step: 2 Unlock
Step: 3 Unlock