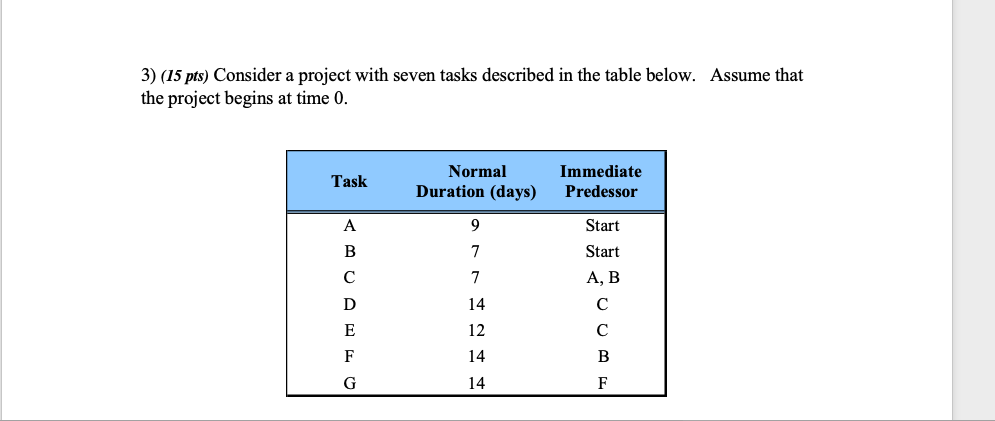
Question: 3) (15 pts) Consider a project with seven tasks described in the table below. Assume that the project begins at time 0. Task Normal Duration

3) (15 pts) Consider a project with seven tasks3) (15 pts) Consider a project with seven tasks3) (15 pts) Consider a project with seven tasks3) (15 pts) Consider a project with seven tasks

3) (15 pts) Consider a project with seven tasks described in the table below. Assume that the project begins at time 0. Task Normal Duration (days) Immediate Predessor Start Start A,B a) Using the information in the above table, construct a spreadsheet showing early and late starting and finish times for all tasks as well as total slack. If you used total slack to prioritize tasks, which task(s) would have the lowest priority? b) You have discovered that task C cannot be started until a certain machine is delivered; the subcontractor on this project has promised that this machine would be delivered at the beginning of day 12 (task C can be started anytime after the machine has been delivered). Using the information in the above table, does this additional information imply that the project will be delayed beyond its completion time in part a? Does this information cause you to change your estimate of which task(s) have the lowest priority (based on total slack)? 4)_(20 pts) Your company is trying to assembly a new product for a customer; the parts for the product have been outsourced to various contractors. The first four stages of this project represent the production of these parts by the contractors. Once the parts are completed and shipped to your company, you can assemble the final product in Stage 5). Your customer is very eager to receive shipment of this product. Based on information from the contractors, you estimate that the duration of the first four stages can be represented by a uniform distribution with optimistic times of 30 days and pessimistic times of 50 days. Engineers in your company estimate that the time needed to assemble the final product (in Stage 5) is uniformly distributed between 12 and 18 days. Stage 1 Stage 2 START Stage 5 (final assembly) END LEND Stage 3 Stage 4 a) You want to promise your customer a due date that you can meet with at least a probability of .75. Using the Classic PERT model, what due date would you set? What is the ECP (Expected Critical Path) in this case? b) Using a Monte Carlo simulation with at least 200 trials, what is the expected makespan? What is a 90 percent confidence interval for the true expected makespan? What is the due date that you would give your customer (that you can meet with at least a .75 probability)? c) Assume that there is a $650 incentive bonus if the project is completed in 60 days or less. What is the expected value of this bonus based on a Monte Carlo simulation? 3) (15 pts) Consider a project with seven tasks described in the table below. Assume that the project begins at time 0. Task Normal Duration (days) Immediate Predessor Start Start A,B a) Using the information in the above table, construct a spreadsheet showing early and late starting and finish times for all tasks as well as total slack. If you used total slack to prioritize tasks, which task(s) would have the lowest priority? b) You have discovered that task C cannot be started until a certain machine is delivered; the subcontractor on this project has promised that this machine would be delivered at the beginning of day 12 (task C can be started anytime after the machine has been delivered). Using the information in the above table, does this additional information imply that the project will be delayed beyond its completion time in part a? Does this information cause you to change your estimate of which task(s) have the lowest priority (based on total slack)? 4)_(20 pts) Your company is trying to assembly a new product for a customer; the parts for the product have been outsourced to various contractors. The first four stages of this project represent the production of these parts by the contractors. Once the parts are completed and shipped to your company, you can assemble the final product in Stage 5). Your customer is very eager to receive shipment of this product. Based on information from the contractors, you estimate that the duration of the first four stages can be represented by a uniform distribution with optimistic times of 30 days and pessimistic times of 50 days. Engineers in your company estimate that the time needed to assemble the final product (in Stage 5) is uniformly distributed between 12 and 18 days. Stage 1 Stage 2 START Stage 5 (final assembly) END LEND Stage 3 Stage 4 a) You want to promise your customer a due date that you can meet with at least a probability of .75. Using the Classic PERT model, what due date would you set? What is the ECP (Expected Critical Path) in this case? b) Using a Monte Carlo simulation with at least 200 trials, what is the expected makespan? What is a 90 percent confidence interval for the true expected makespan? What is the due date that you would give your customer (that you can meet with at least a .75 probability)? c) Assume that there is a $650 incentive bonus if the project is completed in 60 days or less. What is the expected value of this bonus based on a Monte Carlo simulation

Step by Step Solution

There are 3 Steps involved in it

1 Expert Approved Answer
Step: 1 Unlock blur-text-image
Question Has Been Solved by an Expert!

Get step-by-step solutions from verified subject matter experts

Step: 2 Unlock
Step: 3 Unlock

Students Have Also Explored These Related General Management Questions!