Question: 3. 25 Points Using the attached Figure 3.5 and Table 3.3 (separate pdf), a. What is the per unit inventory cost for Project JJ using
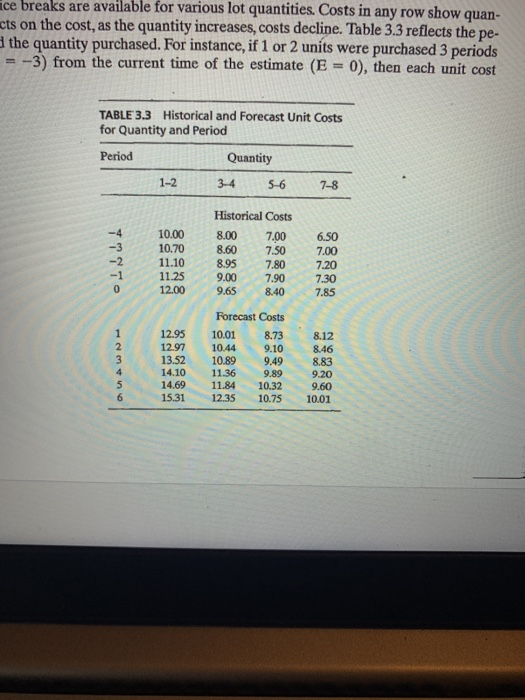
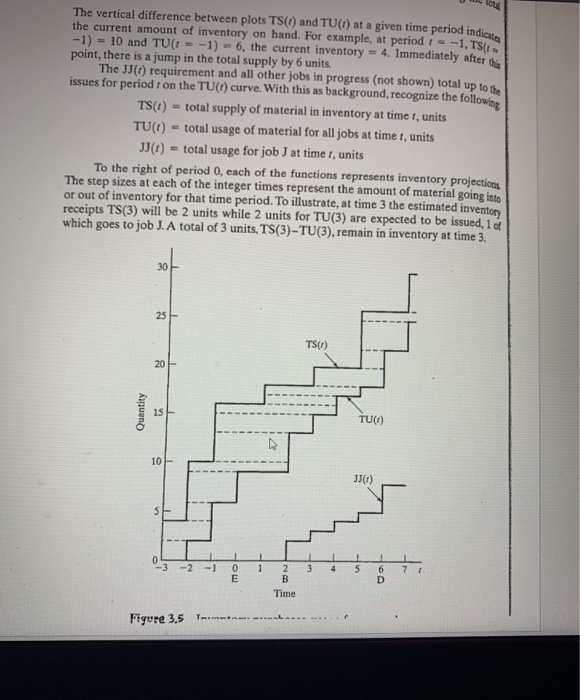
3. 25 Points Using the attached Figure 3.5 and Table 3.3 (separate pdf), a. What is the per unit inventory cost for Project JJ using the LIFO Policy? (15 points) b. What does it mean if the TU(t) curve crosses over the TS(t) curve at any time? (10 points) ace breaks are available for various lot quantities. Costs in any row show quan- cts on the cost, as the quantity increases, costs decline. Table 3.3 reflects the pe- the quantity purchased. For instance, if 1 or 2 units were purchased 3 periods = -3) from the current time of the estimate (E = 0), then each unit cost TABLE 3.3 Historical and Forecast Unit Costs for Quantity and Period Period Quantity 1-2 3.4 5-6 7-8 TPPno 10.00 10.70 11.10 11.25 12.00 Historical Costs 8.00 7.00 8.60 7.50 8.95 7.80 9.00 7.90 9.65 8.40 6.50 7.00 7.20 7.30 7.85 1 2 3 4 5 6 12.95 12.97 13.52 14.10 14.69 15.31 Forecast Costs 10.01 8.73 10.44 9.10 9.49 11.36 9.89 11.84 10.32 12.35 10.75 10.89 8.12 8.46 8.83 9.20 9.60 10.01 The vertical difference between plots TS(I) and TU(T) at a given time period indicates the current amount of inventory on hand. For example, at period : -1, TS(1 -1) - 10 and TU(t = -1) - 6, the current inventory = 4. Immediately after the point, there is a jump in the total supply by 6 units The JJ(1) requirement and all other jobs in progress (not shown) total up to the issues for period 1 on the TU(t) curve. With this as background, recognize the following TS(I) = total supply of material in inventory at time t, units TU(t) = total usage of material for all jobs at time t, units JJ() = total usage for job J at time t, units To the right of period 0, each of the functions represents inventory projections The step sizes at each of the integer times represent the amount of material going into or out of inventory for that time period. To illustrate, at time 3 the estimated inventory receipts TS(3) will be 2 units while 2 units for TU(3) are expected to be issued, 1 of which goes to job J. A total of 3 units, TS(3) - TU(3), remain in inventory at time 3. 30 25 TS(O) 20 Quantity 15 TUO) 10 JJ:) 5 1 1 1 -3 - 2 - 1 0 E 4 1 5 1 7 3 1 2 B Time 6 D Figure 3.5 TA 3. 25 Points Using the attached Figure 3.5 and Table 3.3 (separate pdf), a. What is the per unit inventory cost for Project JJ using the LIFO Policy? (15 points) b. What does it mean if the TU(t) curve crosses over the TS(t) curve at any time? (10 points) ace breaks are available for various lot quantities. Costs in any row show quan- cts on the cost, as the quantity increases, costs decline. Table 3.3 reflects the pe- the quantity purchased. For instance, if 1 or 2 units were purchased 3 periods = -3) from the current time of the estimate (E = 0), then each unit cost TABLE 3.3 Historical and Forecast Unit Costs for Quantity and Period Period Quantity 1-2 3.4 5-6 7-8 TPPno 10.00 10.70 11.10 11.25 12.00 Historical Costs 8.00 7.00 8.60 7.50 8.95 7.80 9.00 7.90 9.65 8.40 6.50 7.00 7.20 7.30 7.85 1 2 3 4 5 6 12.95 12.97 13.52 14.10 14.69 15.31 Forecast Costs 10.01 8.73 10.44 9.10 9.49 11.36 9.89 11.84 10.32 12.35 10.75 10.89 8.12 8.46 8.83 9.20 9.60 10.01 The vertical difference between plots TS(I) and TU(T) at a given time period indicates the current amount of inventory on hand. For example, at period : -1, TS(1 -1) - 10 and TU(t = -1) - 6, the current inventory = 4. Immediately after the point, there is a jump in the total supply by 6 units The JJ(1) requirement and all other jobs in progress (not shown) total up to the issues for period 1 on the TU(t) curve. With this as background, recognize the following TS(I) = total supply of material in inventory at time t, units TU(t) = total usage of material for all jobs at time t, units JJ() = total usage for job J at time t, units To the right of period 0, each of the functions represents inventory projections The step sizes at each of the integer times represent the amount of material going into or out of inventory for that time period. To illustrate, at time 3 the estimated inventory receipts TS(3) will be 2 units while 2 units for TU(3) are expected to be issued, 1 of which goes to job J. A total of 3 units, TS(3) - TU(3), remain in inventory at time 3. 30 25 TS(O) 20 Quantity 15 TUO) 10 JJ:) 5 1 1 1 -3 - 2 - 1 0 E 4 1 5 1 7 3 1 2 B Time 6 D Figure 3.5 TA


