

Question: Using the attached Figure 3.5 and Table 3.3 (separate pdf),a. What is the per unit inventory cost for Project JJ using the LIFO Policy? (15
Using the attached Figure 3.5 and Table 3.3 (separate pdf),a. What is the per unit inventory cost for Project JJ using the LIFO Policy? (15 points)b. What does it mean if the TU(t) curve crosses over the TS(t) curve at any time? (10 points)
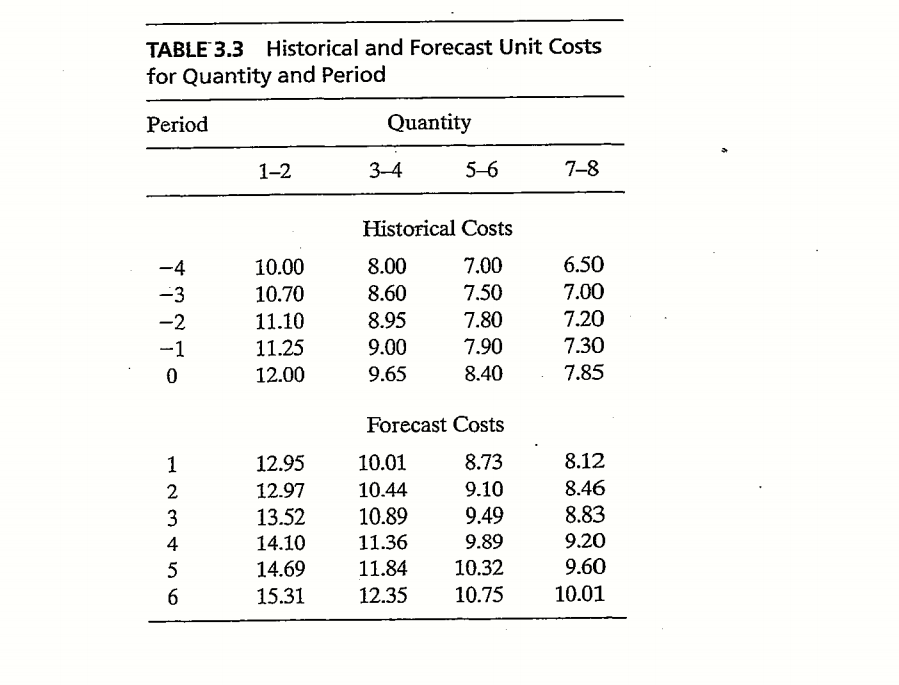
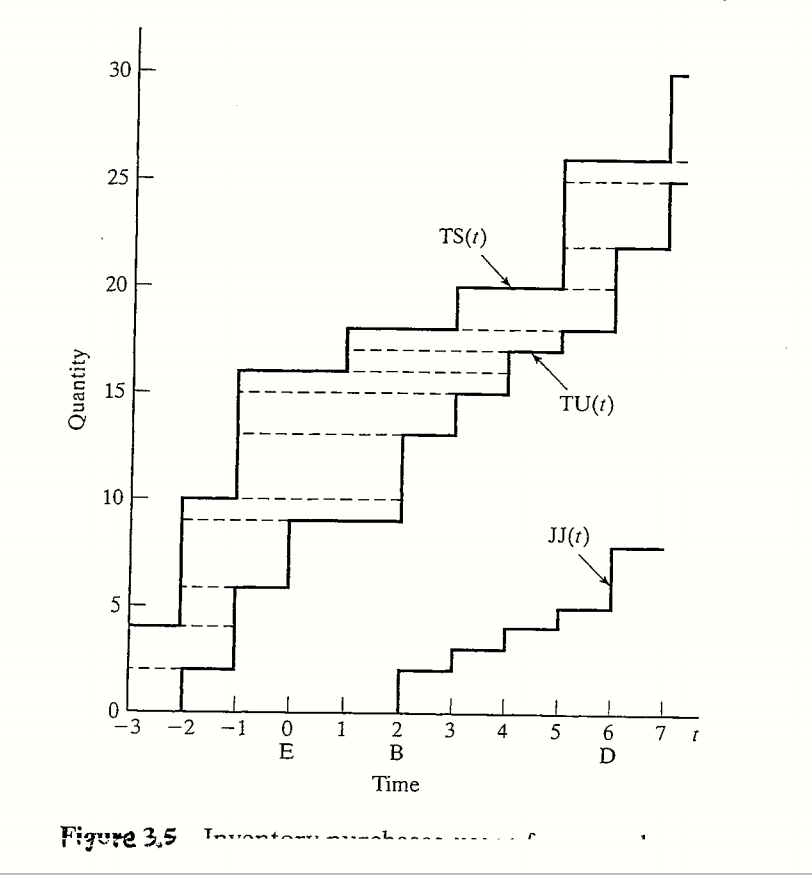
TABLE*3.3 Historical and Forecast Unit Costs for Quantity and Period Period Quantity 1-2 3-4 5-6 7-8 Historical Costs -4 -3 -2 -1 10.00 10.70 11.10 11.25 12.00 8.00 8.60 8.95 9.00 9.65 7.00 7.50 7.80 7.90 8.40 6.50 7.00 7.20 7.30 7.85 0 Forecast Costs 8.12 1 2 3 4 5 6 12.95 12.97 13.52 14.10 14.69 15.31 10.01 10.44 10.89 11.36 11.84 12.35 8.73 9.10 9.49 9.89 10.32 10.75 8.46 8.83 9.20 9.60 10.01 30 25 - TS(1) 20 - Quantity 15 TU(t) 10 JJ(t) 5 0 -3 -2 -1 1 . 4 1 5 3 7 0 E 2 B Time A 6 D Figure 3,5 Imunntn-e m..-ahmane 1 TABLE*3.3 Historical and Forecast Unit Costs for Quantity and Period Period Quantity 1-2 3-4 5-6 7-8 Historical Costs -4 -3 -2 -1 10.00 10.70 11.10 11.25 12.00 8.00 8.60 8.95 9.00 9.65 7.00 7.50 7.80 7.90 8.40 6.50 7.00 7.20 7.30 7.85 0 Forecast Costs 8.12 1 2 3 4 5 6 12.95 12.97 13.52 14.10 14.69 15.31 10.01 10.44 10.89 11.36 11.84 12.35 8.73 9.10 9.49 9.89 10.32 10.75 8.46 8.83 9.20 9.60 10.01 30 25 - TS(1) 20 - Quantity 15 TU(t) 10 JJ(t) 5 0 -3 -2 -1 1 . 4 1 5 3 7 0 E 2 B Time A 6 D Figure 3,5 Imunntn-e m..-ahmane 1
Step by Step Solution
There are 3 Steps involved in it

Get step-by-step solutions from verified subject matter experts