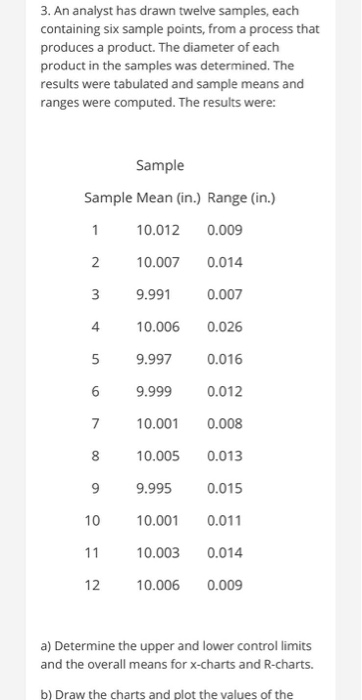
Question: 3. An analyst has drawn twelve samples, each containing six sample points, from a process that produces a product. The diameter of each product in

3. An analyst has drawn twelve samples, each
3. An analyst has drawn twelve samples, each containing six sample points, from a process that produces a product. The diameter of each product in the samples was determined. The results were tabulated and sample means and ranges were computed. The results were: Sample Sample Mean (in.) Range (in.) 10.012 0.009 1 2 10.007 0.014 3 9.991 0.007 4 10.006 0.026 5 9.997 0.016 0.012 6 9.999 7 10.001 0.008 8 10.005 9 9.995 10 10.001 0.013 0.015 0.011 0.014 0.009 11 10.003 12 10.006 a) Determine the upper and lower control limits and the overall means for X-charts and R-charts. b) Draw the charts and plot the values of the a) Determine the upper and lower control limits and the overall means for x-charts and R-charts. b) Draw the charts and plot the values of the sample means and ranges. c) Do the data indicate a process that is in control? d) Why or why not

Step by Step Solution

There are 3 Steps involved in it

1 Expert Approved Answer
Step: 1 Unlock blur-text-image
Question Has Been Solved by an Expert!

Get step-by-step solutions from verified subject matter experts

Step: 2 Unlock
Step: 3 Unlock

Students Have Also Explored These Related General Management Questions!