

Question: 3. Below is an AOA diagram that includes the optimistic, most likely, and pessimistic time estimates (in days) for each activity. However, we just found
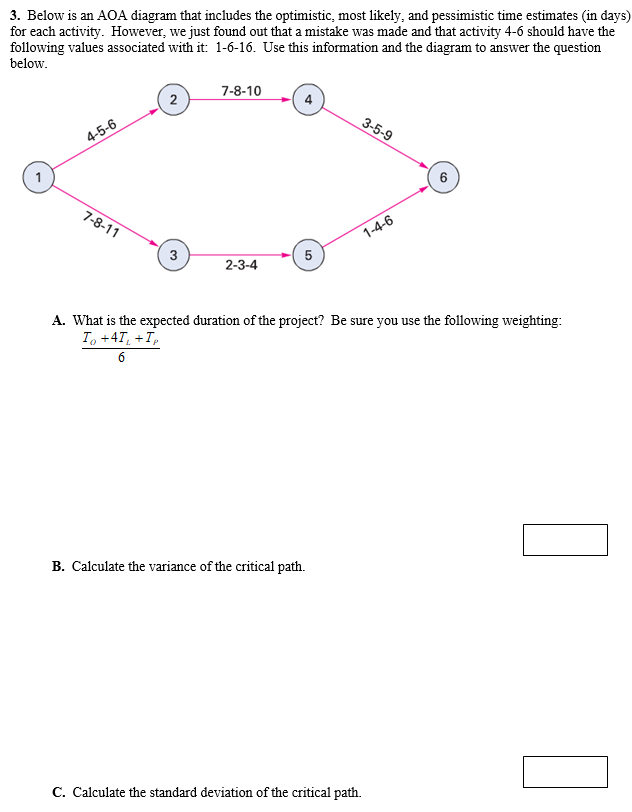
3. Below is an AOA diagram that includes the optimistic, most likely, and pessimistic time estimates (in days) for each activity. However, we just found out that a mistake was made and that activity 4-6 should have the following values associated with it: 1-6-16. Use this information and the diagram to answer the question below. 7-8-10 4-5-6 3-5-9 6 7-8-11 1-4-6 3 5 2-3-4 A. What is the expected duration of the project? Be sure you use the following weighting: To +41, + Ip 6 B. Calculate the variance of the critical path. C. Calculate the standard deviation of the critical path
Step by Step Solution
There are 3 Steps involved in it
1 Expert Approved Answer
Step: 1 Unlock

Question Has Been Solved by an Expert!
Get step-by-step solutions from verified subject matter experts
Step: 2 Unlock
Step: 3 Unlock